การวิเคราะห์ทางเทคนิคประจำวันและการคาดการณ์สำหรับวันที่ 19 พฤศจิกายน 2025
ด้านล่างนี้เป็นการวิเคราะห์ทางเทคนิคและการคาดการณ์รายละเอียดสำหรับ EURUSD, USDJPY, GBPUSD, AUDUSD, USDCAD, XAUUSD และ Brent สำหรับวันที่ 19 พฤศจิกายน 2025
การคาดการณ์ EURUSD
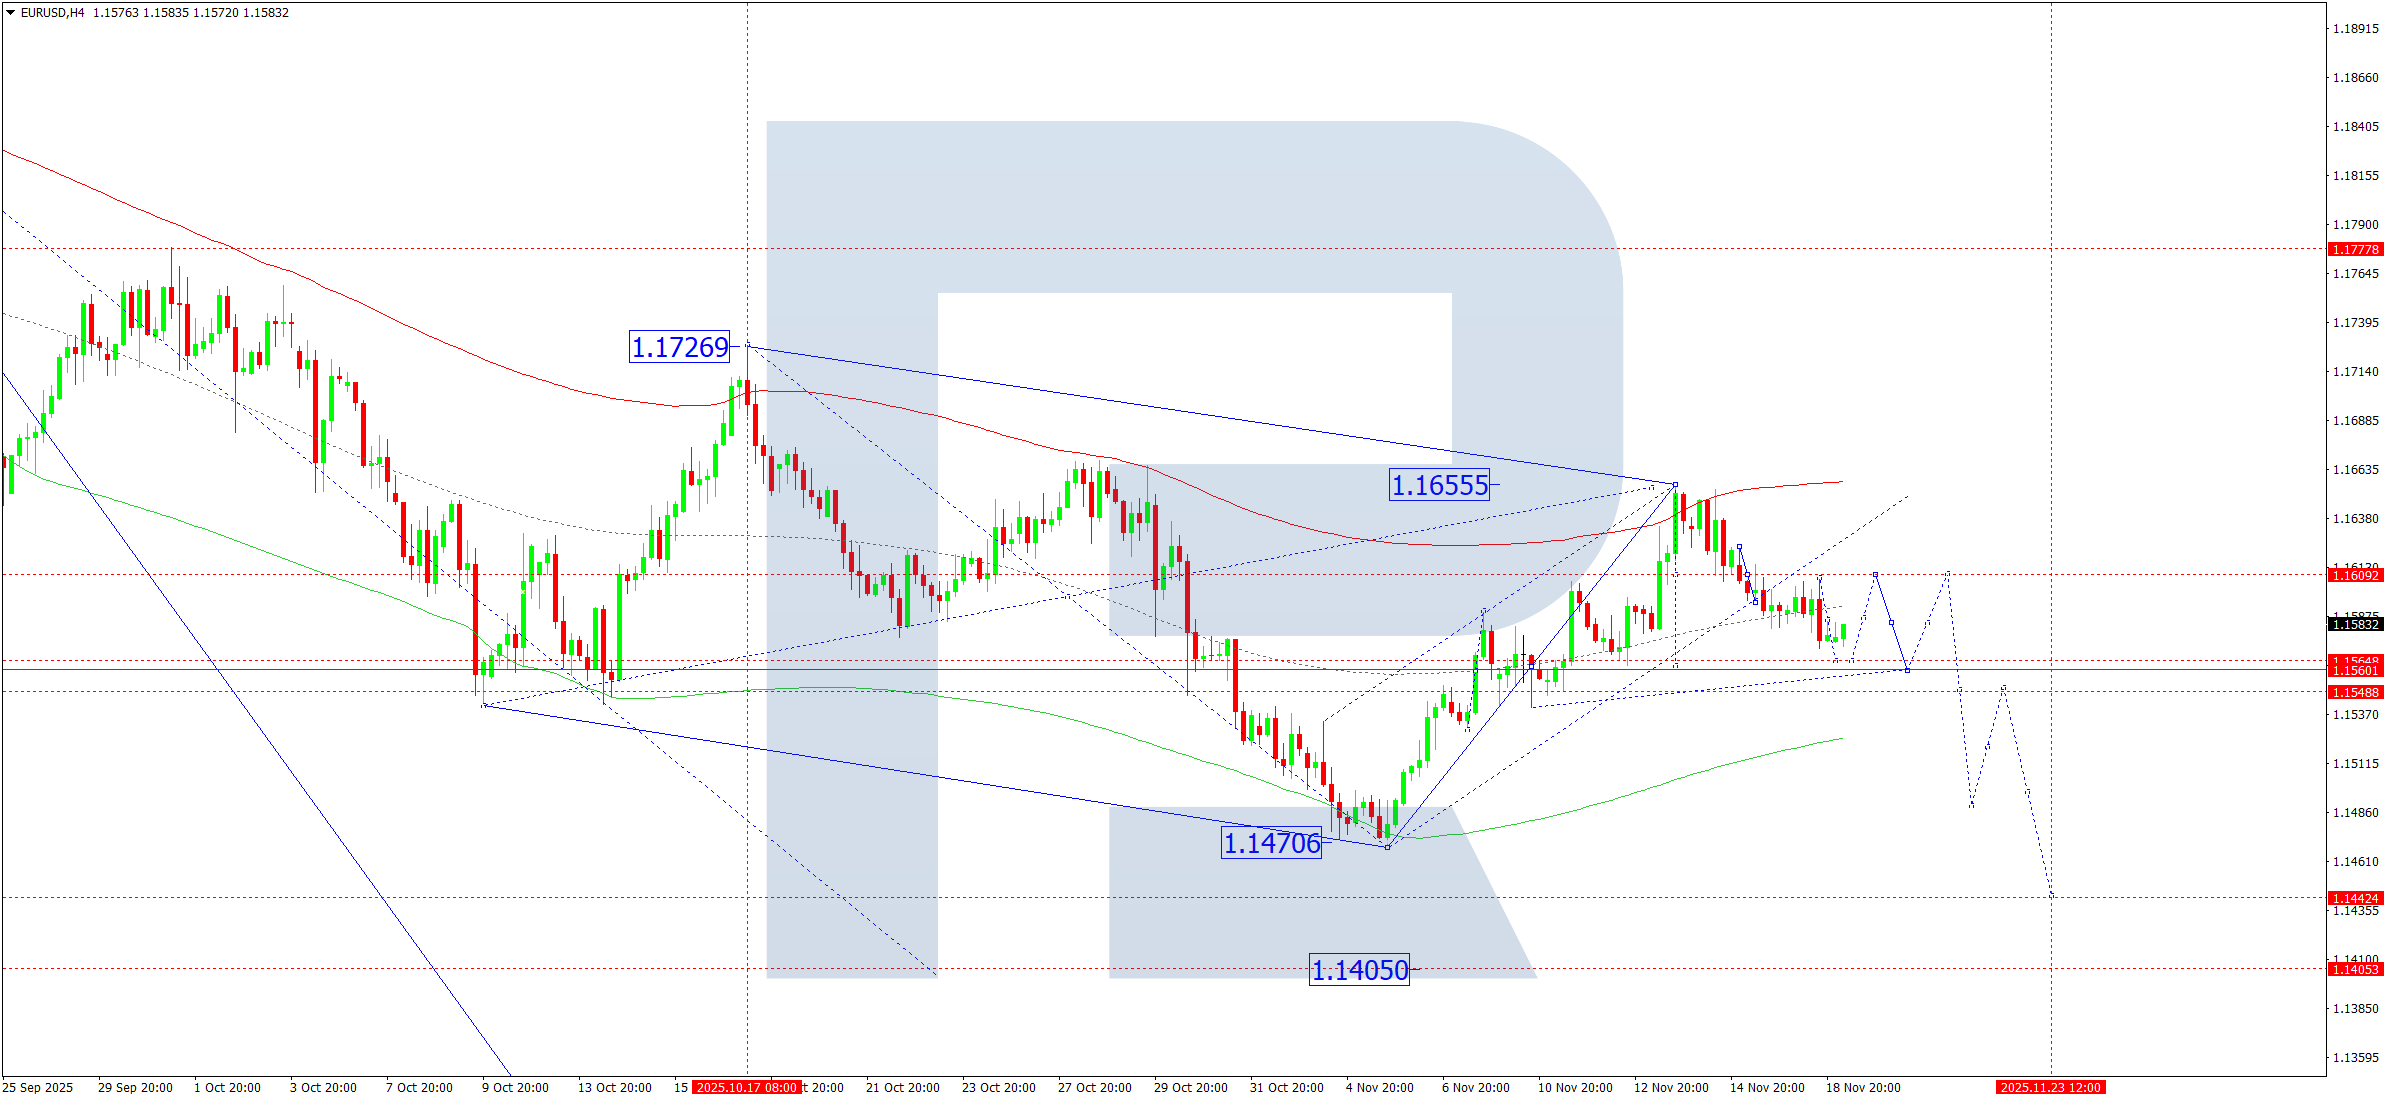
บนกราฟ H4 ของ EURUSD ตลาดได้สร้างกรอบการสะสมแคบ ๆ บริเวณ 1.1608 และได้ทะลุกรอบลงด้านล่าง ช่องคลื่นขาขึ้นแทบจะถูกทำลายโดยสิ้นเชิงแล้ว ในวันที่ 19 พฤศจิกายน 2025 ส่วนหนึ่งของคลื่นแรงกระตุ้นขาลงถัดไปมุ่งหน้าไปยัง 1.1570 ได้ก่อตัวขึ้นแล้ว ขณะนี้ตลาดกำลังก่อตัวกรอบการสะสมแคบ ๆ เหนือระดับดังกล่าว กรอบนี้อาจขยายตัวลงไปที่ 1.1565 และขึ้นไปที่ 1.1600 ก่อนที่ราคาจะปรับตัวลงไปที่ 1.1560 ซึ่งเป็นเป้าหมายแรกภายในโครงสร้างคลื่นขาลงที่มุ่งหน้าไปยัง 1.1405
โครงสร้างคลื่นเอลเลียตและเมทริกซ์ของคลื่นขาลงที่มีจุดหมุน (pivot point) ที่ 1.1660 ยืนยันสถานการณ์นี้และทำหน้าที่เป็นองค์ประกอบสำคัญในโครงสร้างคลื่นของ EURUSD ปัจจุบันตลาดกำลังก่อตัวคลื่นขาลงไปยังเส้นกึ่งกลางของ Price Envelope ที่ 1.1560 วันนี้มีความเป็นไปได้ที่ราคาจะเคลื่อนไหวลงไปยังระดับดังกล่าว และเกิดคลื่นปรับฐานกลับขึ้นไปที่ 1.1606 หลังจากนั้น สถานการณ์คาดการณ์ว่าคลื่นขาลงจะดำเนินต่อไปยังขอบล่างของ Price Envelope ที่ 1.1515 พร้อมโอกาสขยายแนวโน้มไปถึง 1.1405
ตัวชี้วัดทางเทคนิคสำหรับการคาดการณ์ EURUSD วันนี้ บ่งชี้ถึงการปรับตัวลงไปที่ 1.1560
การคาดการณ์ USDJPY
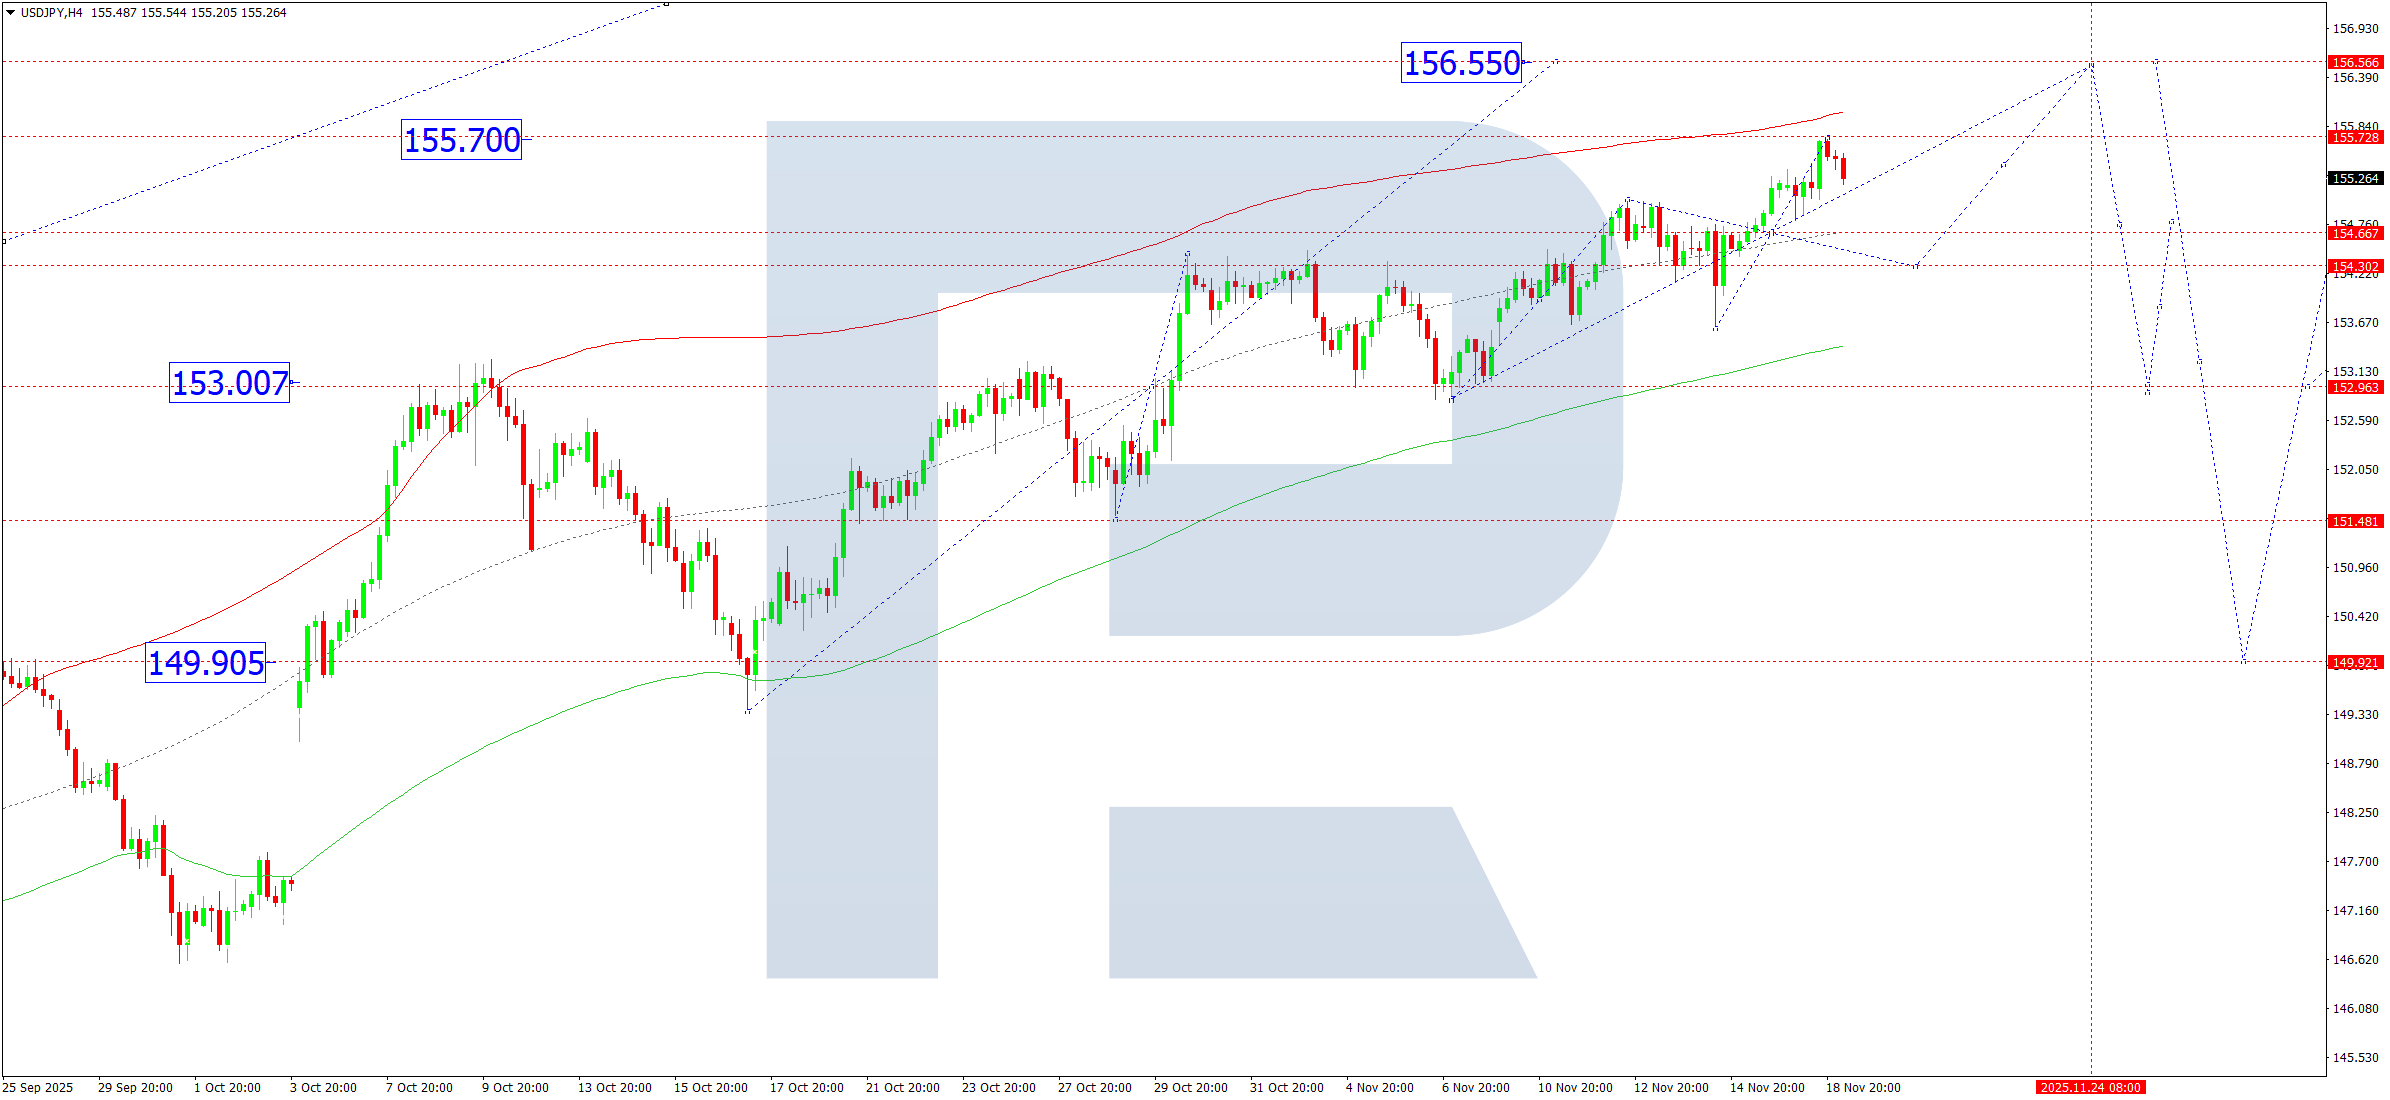
On the USDJPY H4 chart, the market completed an upward wave towards 155.70. On 19 November 2025, a compact consolidation range may form below this level. A breakout downwards from the range brings a correction towards 154.66 into focus at least. Afterwards, an upward wave towards 156.55 becomes possible as a local target. Later, a correction towards 153.00 is not excluded.
The Elliott wave structure and the upward wave matrix with a pivot point at 153.00 confirm this scenario and act as the key elements in this wave structure. At the moment, the market has completed an upward wave towards 155.70 and is forming a consolidation range below this level. A corrective move towards the central line of the Price Envelope at 154.66 is possible. Afterwards, a rise towards its upper boundary at 156.55 remains likely.
Technical indicators for today’s USDJPY forecast suggest a decline towards 154.66, followed by a rise towards 156.55.
การคาดการณ์ GBPUSD
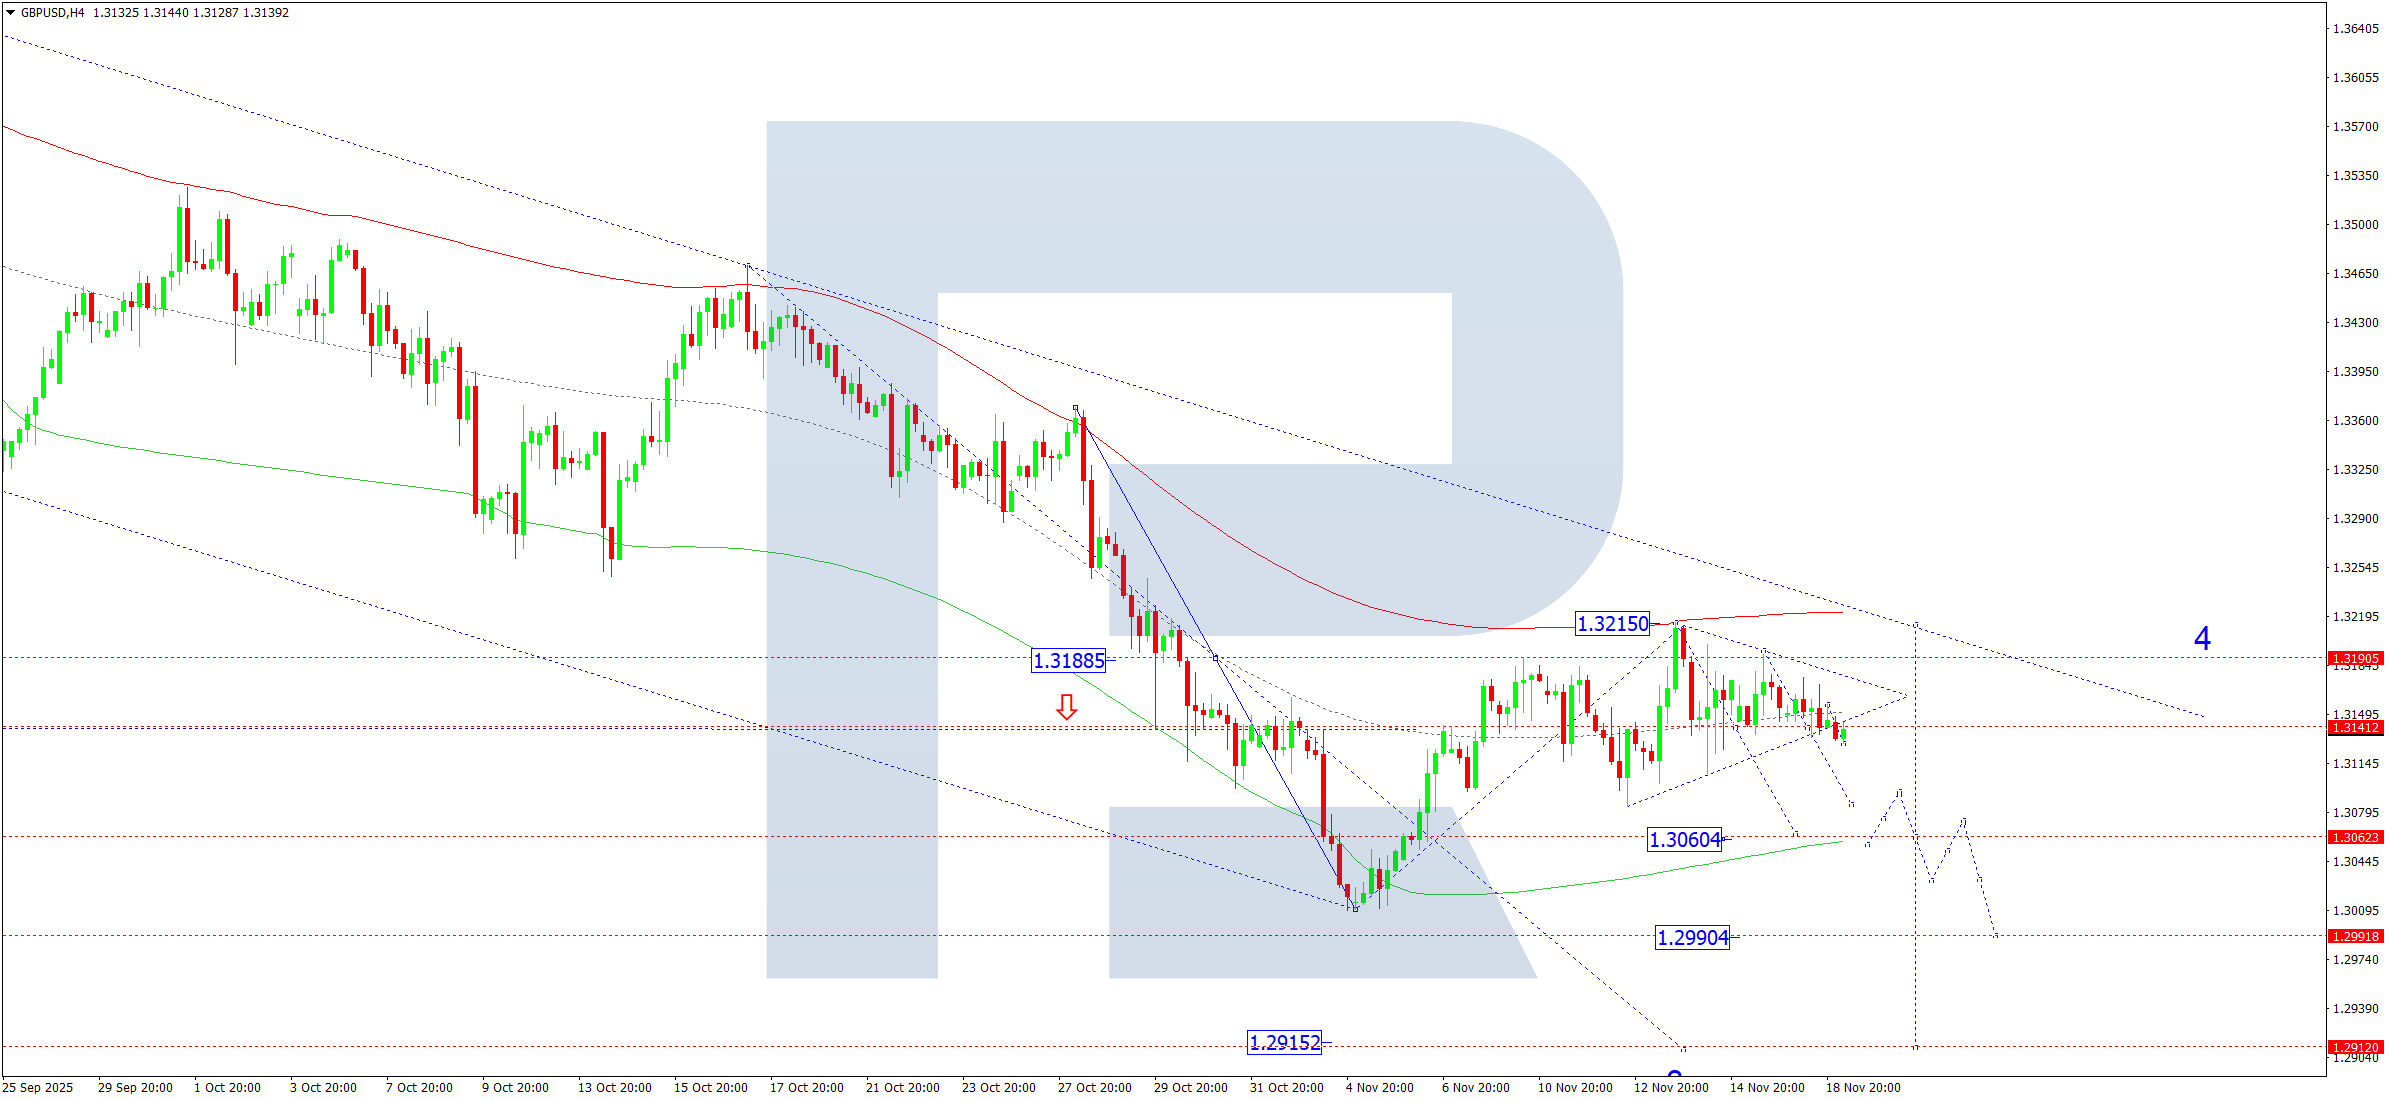
On the GBPUSD H4 chart, the market continues to develop a consolidation range around 1.3140. On 19 November 2025, a breakout downwards from this range and a new downward impulse towards 1.3060 are expected. A breakout below 1.3060 opens the potential for the continuation of the wave towards 1.2990, with the potential to extend the trend to 1.2915 as a local target.
The Elliott wave structure and the downward wave matrix with a pivot point at 1.3188 confirm this scenario and act as the key elements in this wave structure. At the moment, the market completed a correction wave towards the upper boundary of the Price Envelope at 1.3215 (testing from below). Today, the downward wave could continue towards its lower boundary at 1.3060.
Technical indicators for today’s GBPUSD forecast suggest the beginning of a downward wave towards 1.3060.
การคาดการณ์ AUDUSD
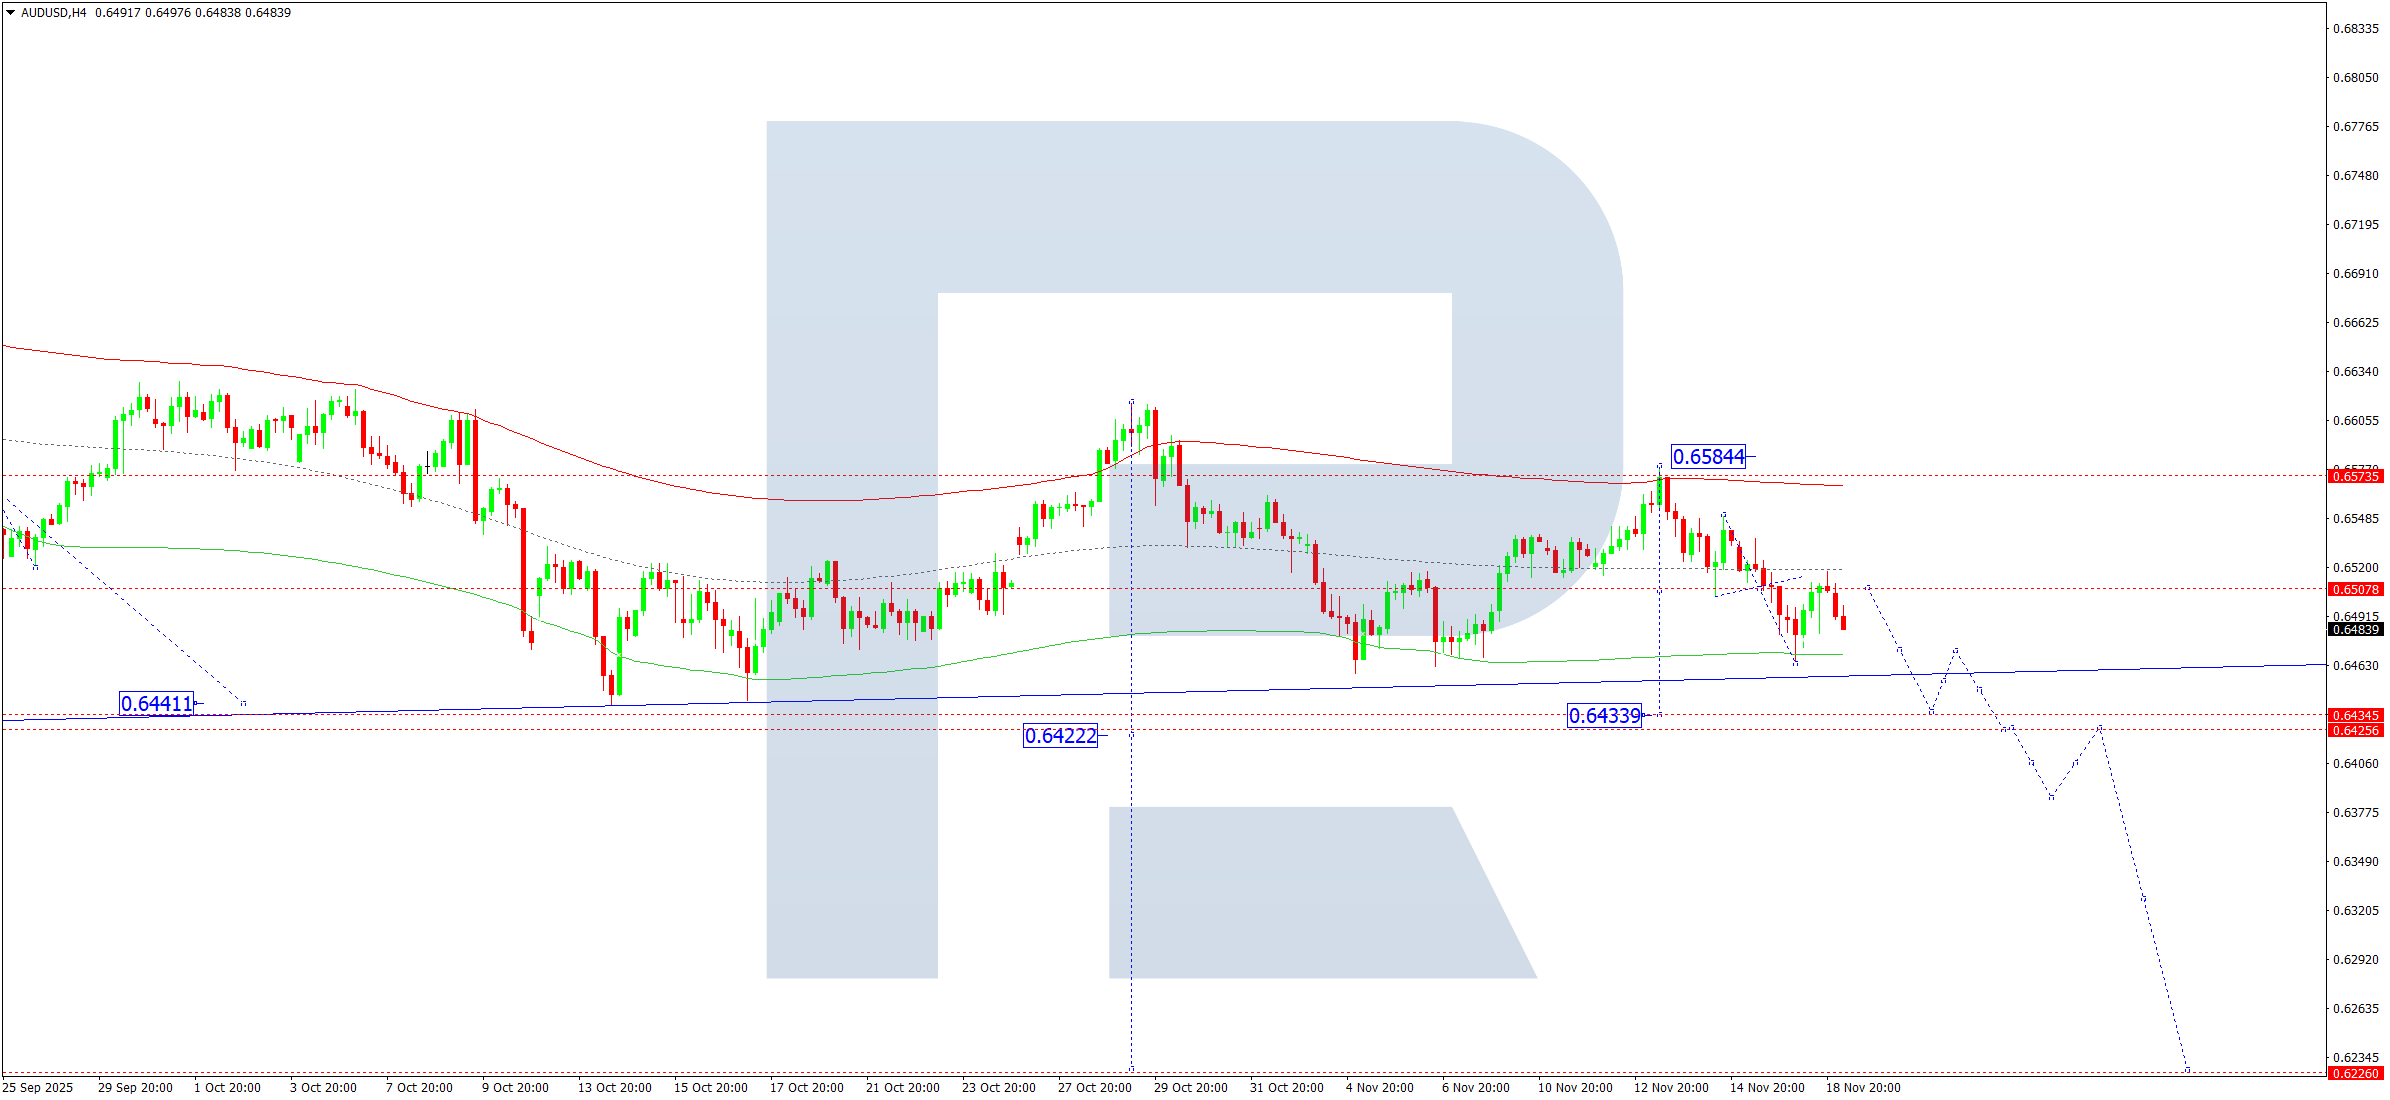
On the AUDUSD H4 chart, the market completed a correction towards 0.6560. On 19 November 2025, the market continues to develop a downward wave towards 0.6434 as a local, estimated target. Afterwards, a compact consolidation range may form around this level. A breakout downwards would open the potential for the continuation of the third downward wave along the trend towards 0.6222.
The Elliott wave structure and the downward wave matrix in AUDUSD with a pivot point at 0.6570 confirm this scenario and act as the key elements in this wave structure. At the moment, the market completed a correction wave towards the upper boundary of the Price Envelope at 0.6584. Today, the outlook includes a continued downward movement towards its lower boundary at 0.6434.
Technical indicators for today’s AUDUSD forecast suggest a continuation of the downward wave towards 0.6434.
การคาดการณ์ USDCAD
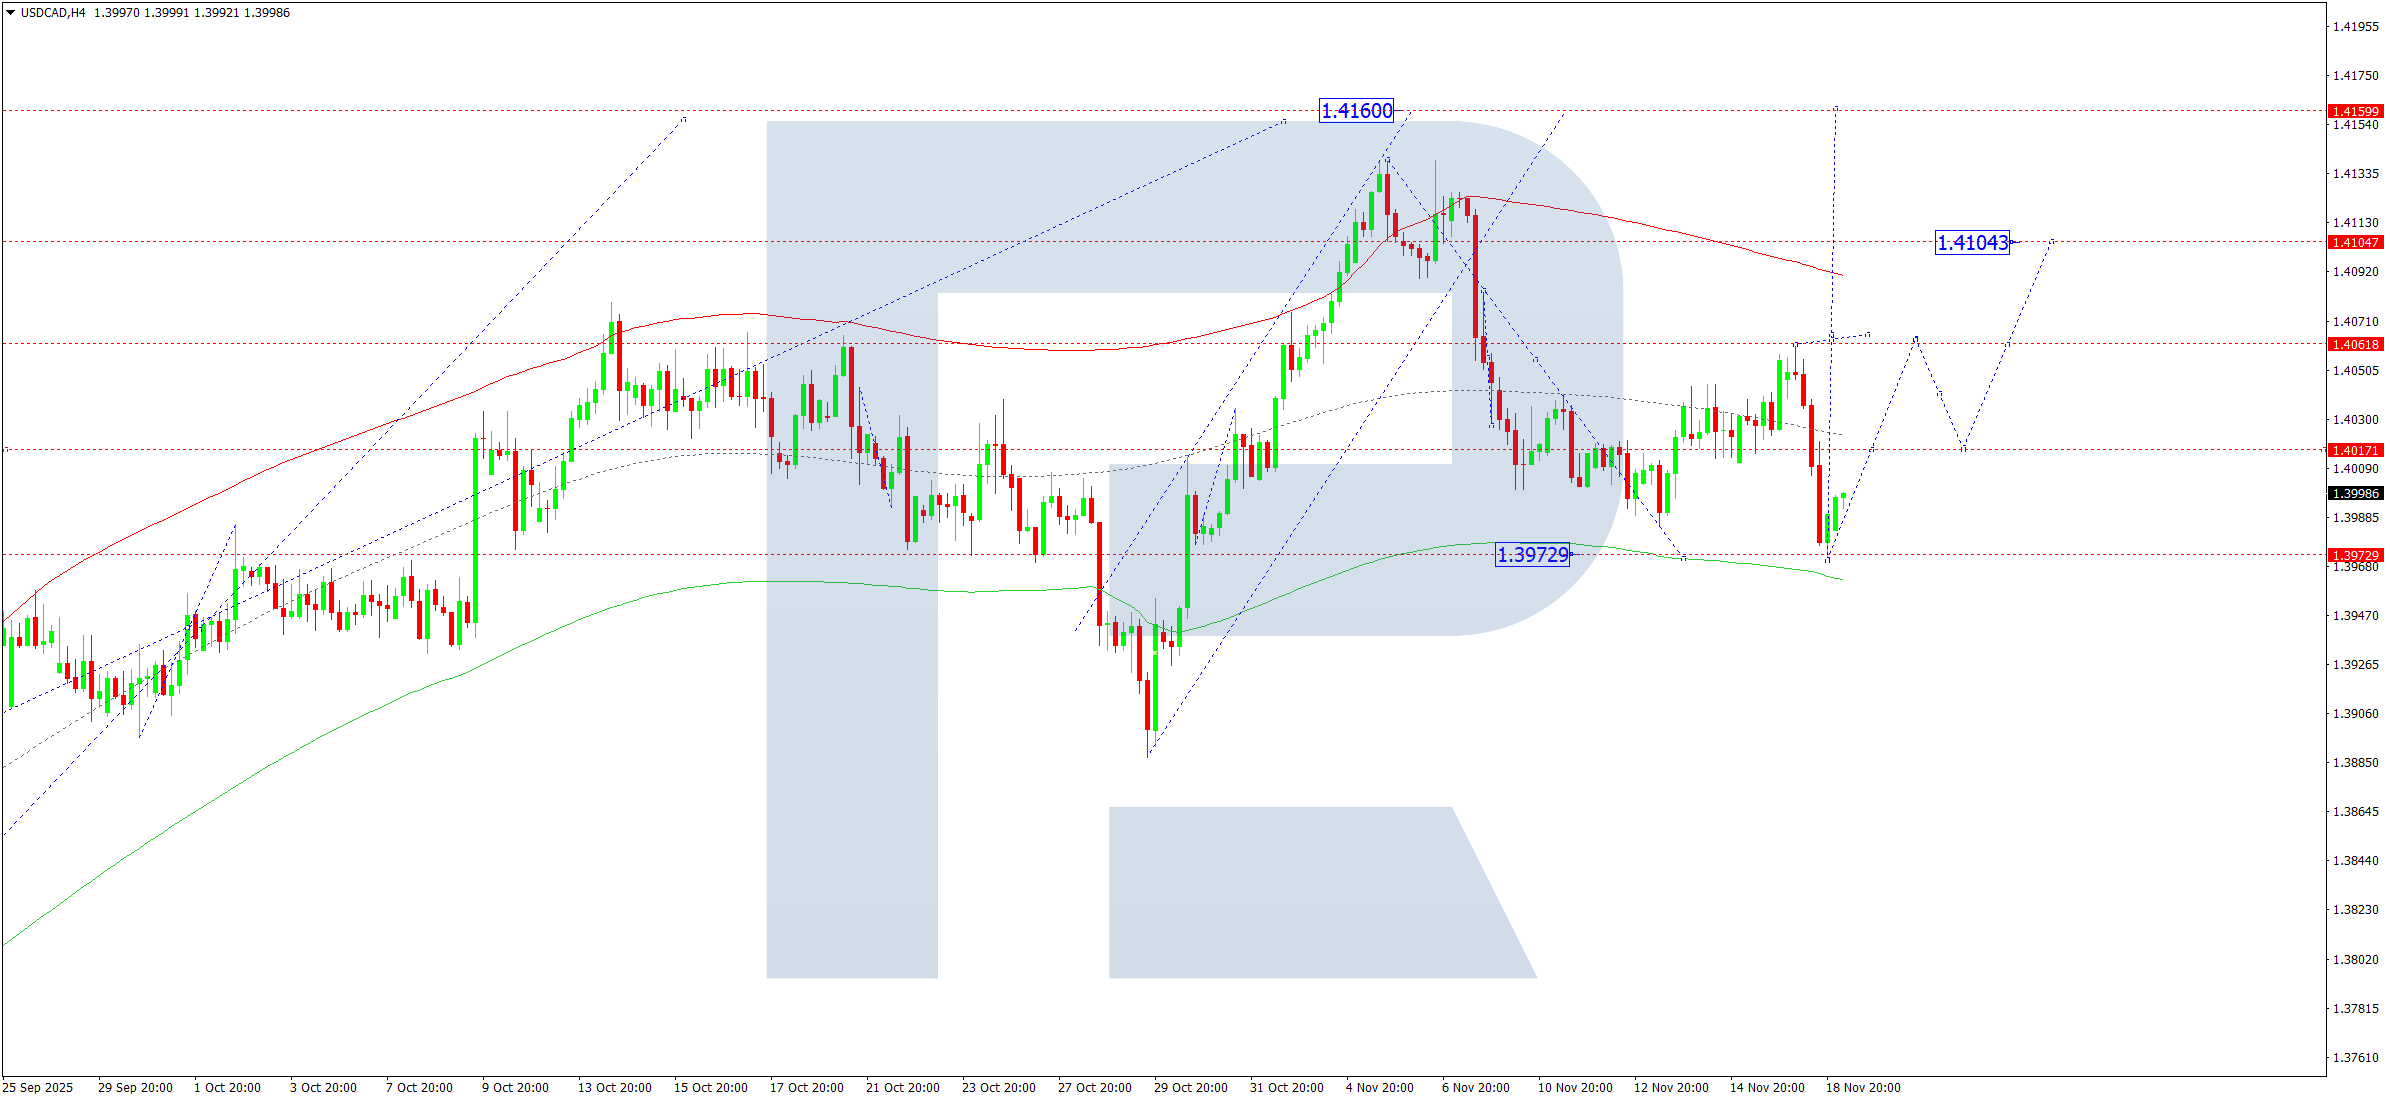
On the USDCAD H4 chart, the market completed a downward wave towards 1.3970. On 19 November 2025, a rising wave towards 1.4017 may start. A breakout above this level would open the potential for the continuation of the wave towards 1.4062. This is the first target within the structure of the upward wave towards 1.4160.
The Elliott wave structure and the upward wave matrix with a pivot point at 1.3939 confirm this scenario and act as the key elements for USDCAD in this wave structure. At the moment, the market continues its correction towards the lower boundary of the Price Envelope at 1.3973. Today, the relevant scenario includes the beginning of a rising wave towards its upper boundary at 1.4160.
Technical indicators for today’s USDCAD forecast suggest a continued upward movement towards 1.4160.
การคาดการณ์ XAUUSD
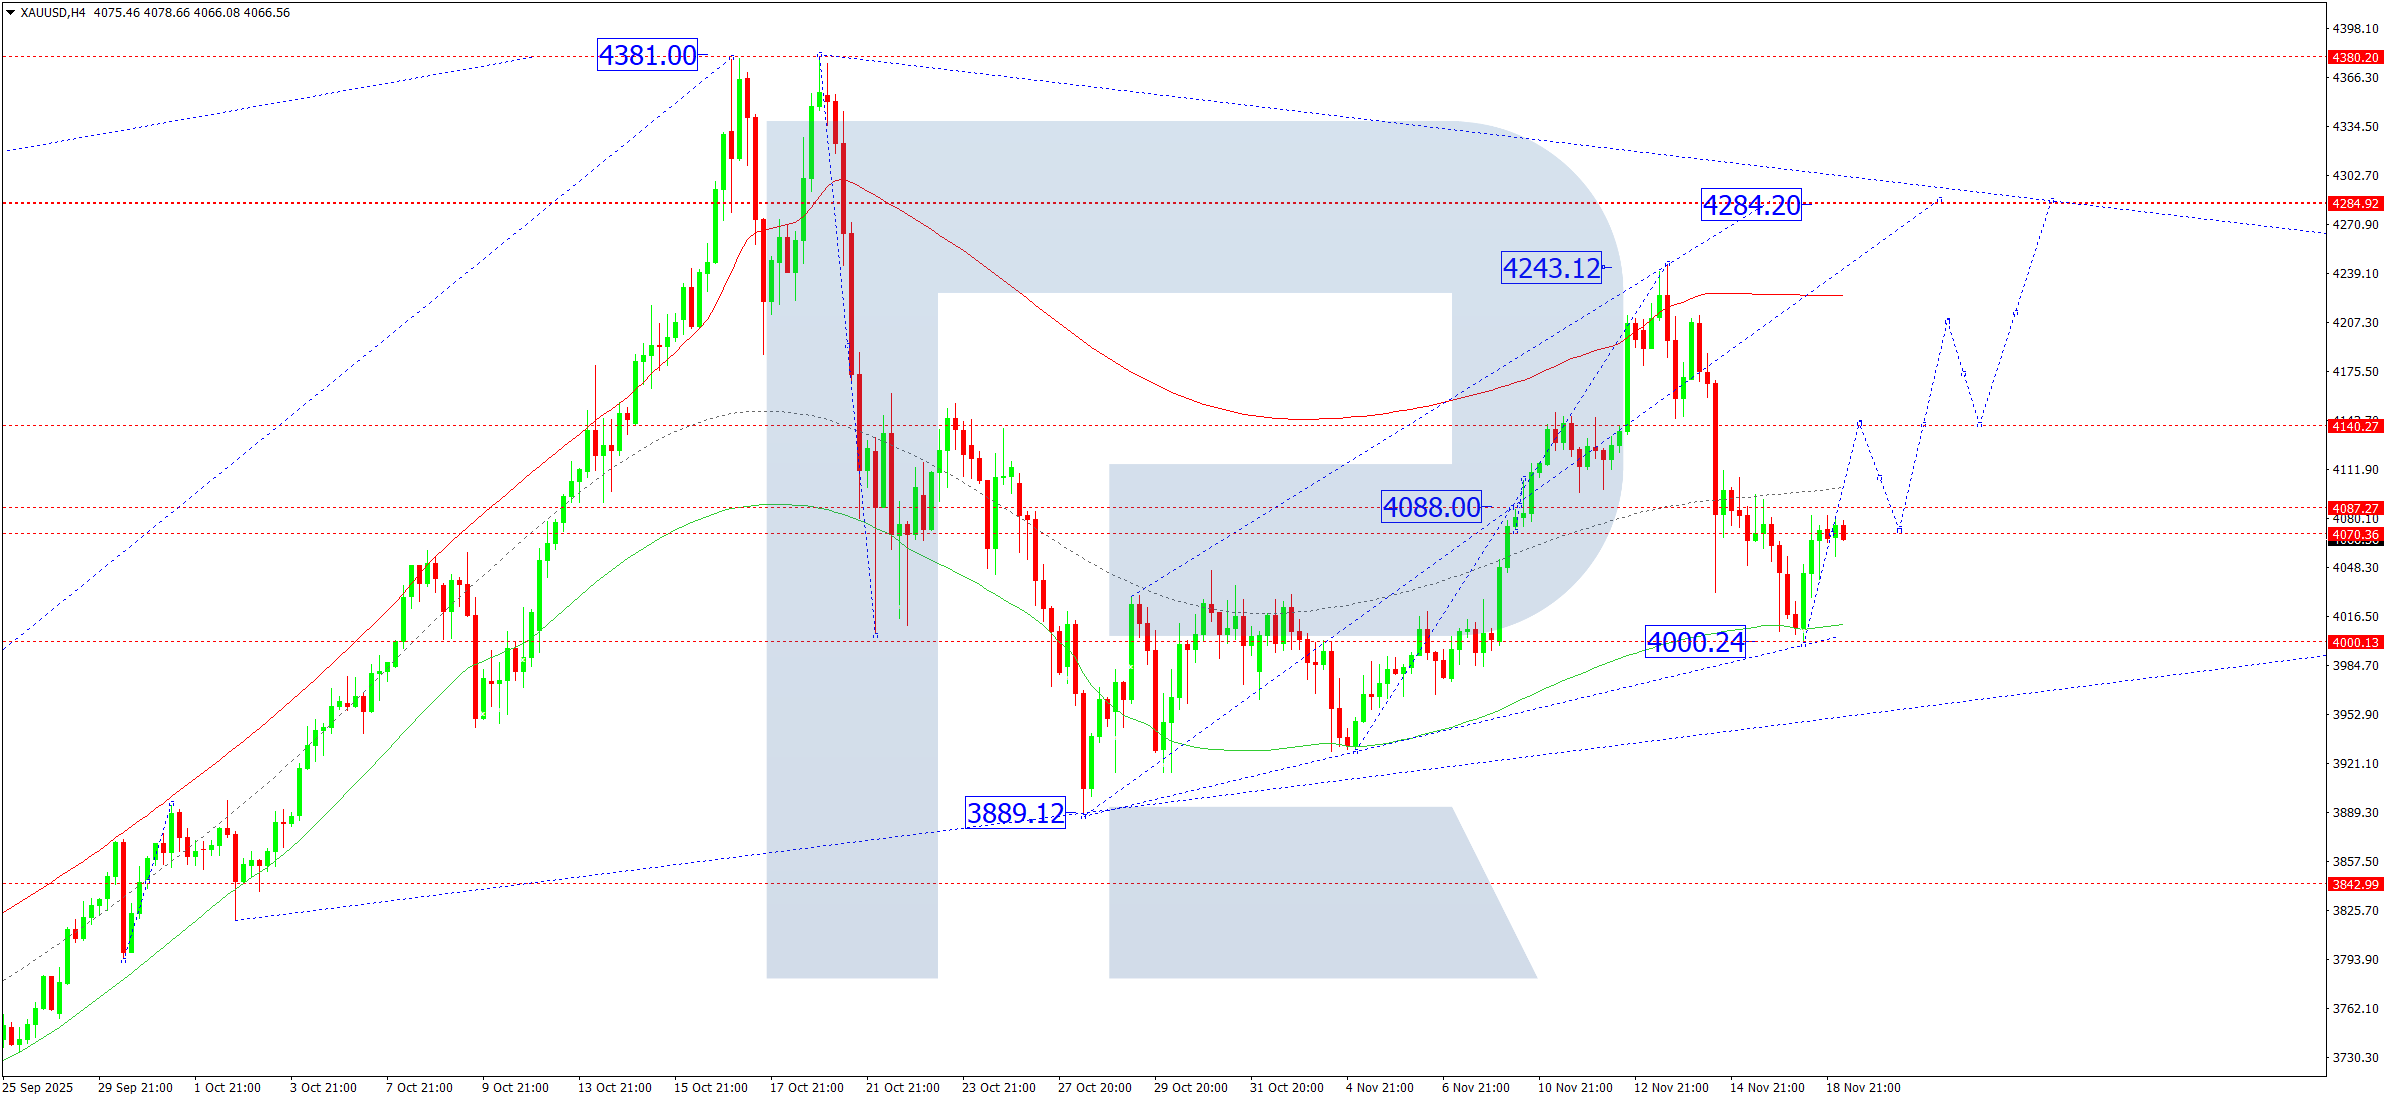
On the XAUUSD H4 chart, the market completed an upward impulse towards 4,070. On 19 November 2025, a compact consolidation range may form around this level. A breakout upwards from the range would open the potential for the continuation of the upward impulse towards 4,140 as the first target within the structure of the rising wave towards 4,284.
The Elliott wave structure and the upward wave matrix with a pivot point at 4,088 confirm this scenario and act as the key elements for XAUUSD in this wave. At the moment, the market started to develop the fifth upward wave towards the upper boundary of the Price Envelope at 4,284.
Technical indicators for today’s XAUUSD forecast suggest an upward wave towards 4,140, 4,208 and 4,284.
การคาดการณ์ Brent
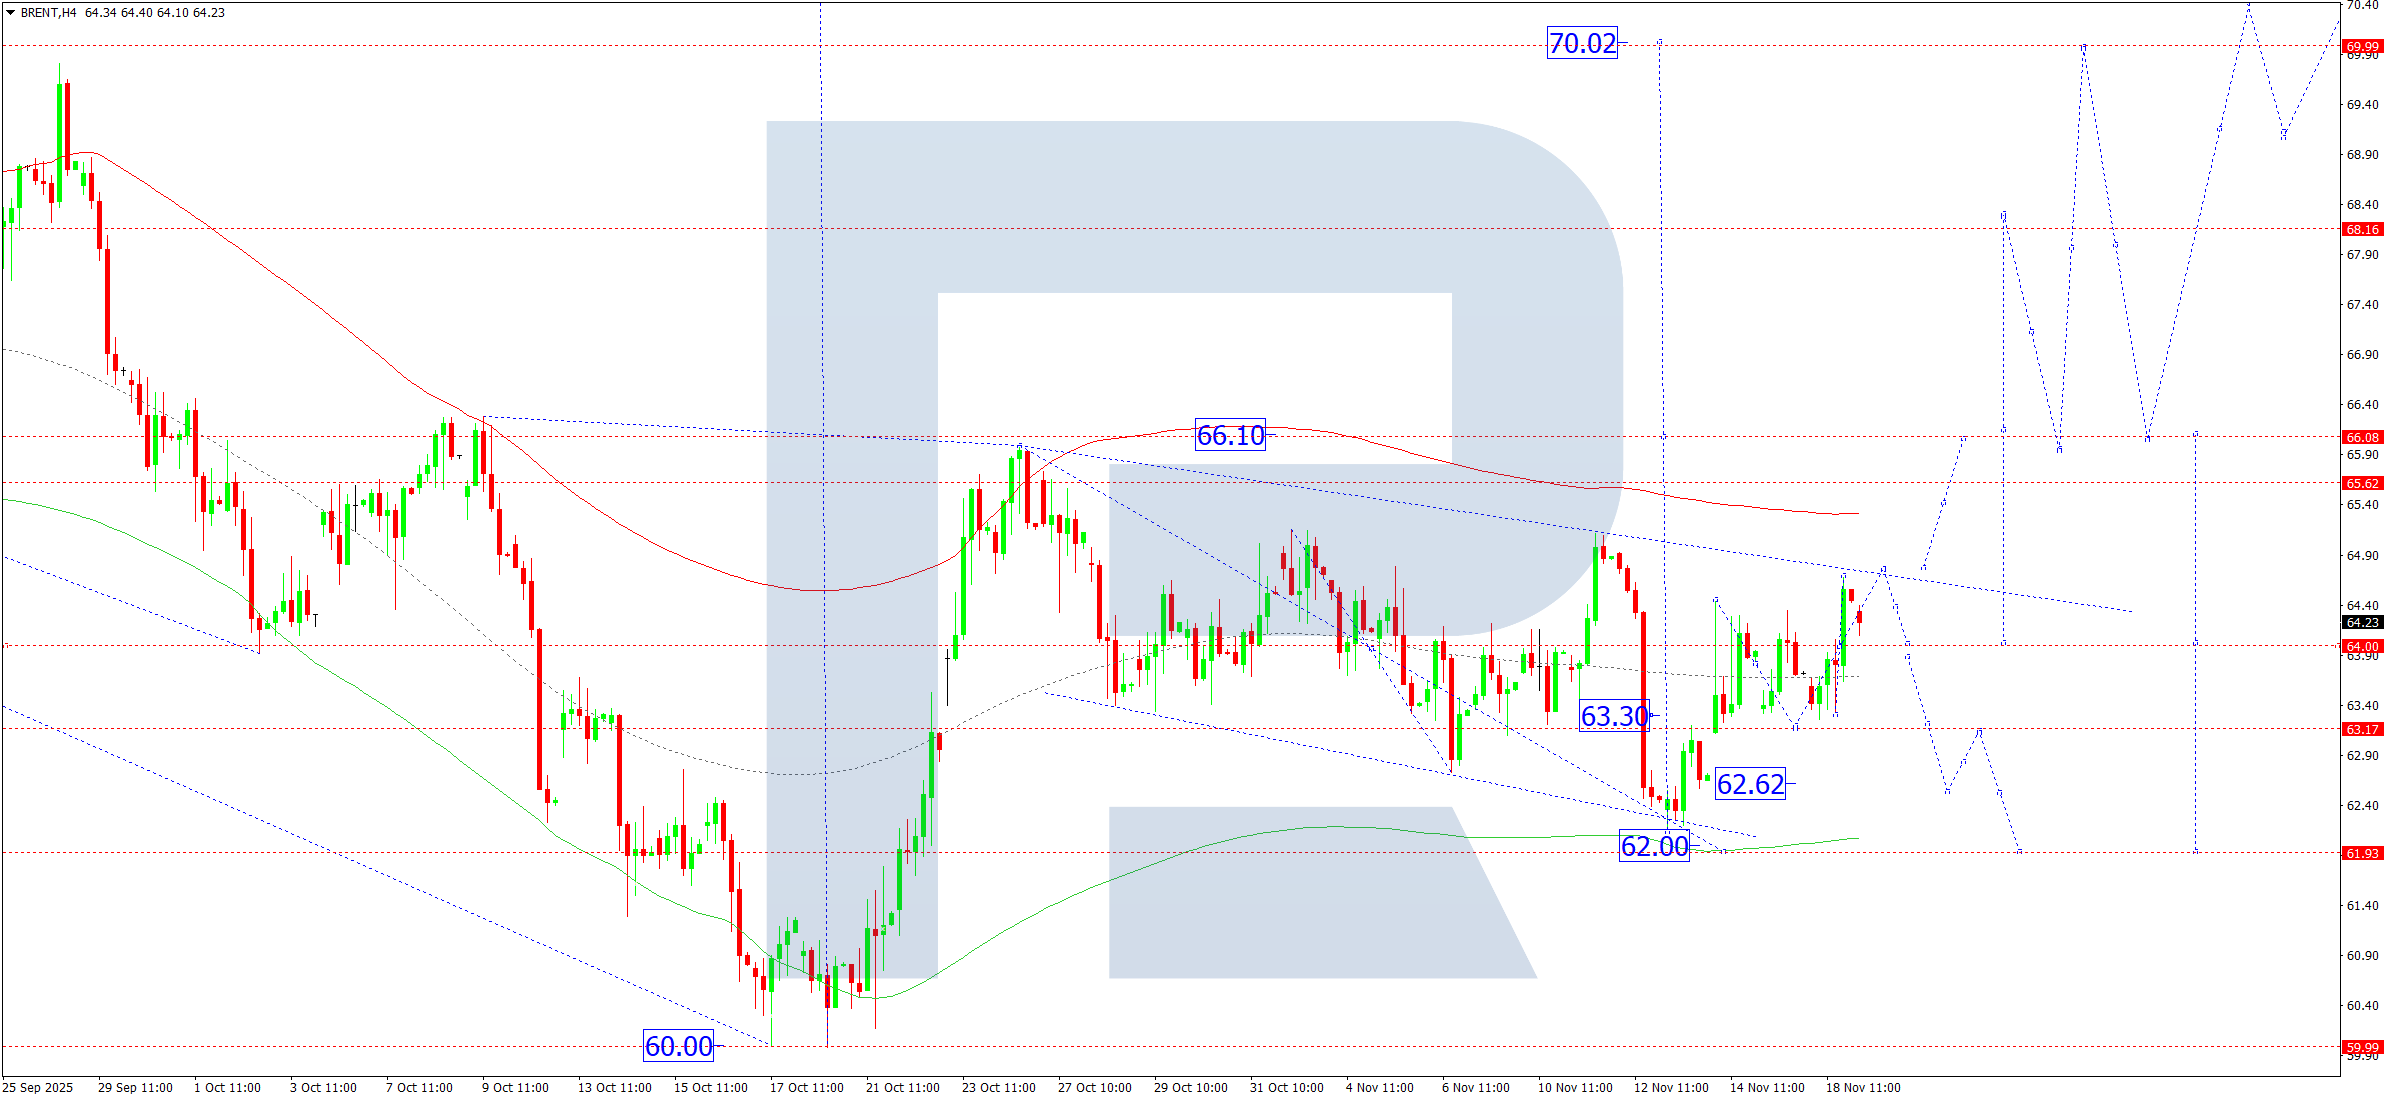
On the Brent H4 chart, the market forms a consolidation range above 64.00. On 19 November 2025, the range could expand upwards to 64.75. A breakout upwards from the range opens the potential for the continuation of the rising wave towards 66.10, with the potential to develop the wave towards 70.00. A breakout downwards from the range keeps open the possibility of another downward corrective move towards 62.00. After this correction completes, a rise towards 70.00 remains possible.
The Elliott wave structure and the upward wave matrix with a pivot point at 64.00 confirm this scenario and act as the key elements for Brent in this wave. At the moment, the market continues to develop a consolidation range around the central line of the Price Envelope at 64.00. Today, a downward breakout from the range suggests a continued correction towards its lower boundary at 62.00. A breakout upwards opens the potential for an upward wave towards its upper boundary at 66.10.
Technical indicators in today’s Brent forecast suggest a rise towards 66.10.
คำชี้แจง: บทความนี้ได้รับการแปลด้วยความช่วยเหลือจากเครื่องมือ AI แม้ว่าจะได้พยายามอย่างเต็มที่ในการรักษาความหมายดั้งเดิม แต่อาจมีความคลาดเคลื่อนหรือข้อบกพร่องบางประการ หากไม่มั่นใจ โปรดอ้างอิงจากต้นฉบับภาษาอังกฤษ
การคาดการณ์ที่นำเสนอในส่วนนี้จะสะท้อนให้เห็นความคิดเห็นส่วนตัวของผู้แต่งเท่านั้น และจะไม่สามารถถูกพิจารณาว่าเป็นแนวทางสำหรับการซื้อขาย RoboForex ไม่รับผิดชอบสำหรับผลลัพธ์การซื้อขายที่อ้างอิงตามคำแนะนำการซื้อขายที่อธิบายเอาไว้ในบทวิจารณ์การวิเคราะห์เหล่านี้