World indices overview: news from US 30, US 500, US Tech, JP 225, and DE 40 for 23 January 2025
Global stock indices continue their upward trend, with the DE 40 index reaching a new all-time high. More details in our analysis and forecast for global indices for 23 January 2025.
US indices forecast: US 30, US 500, US Tech
- Recent data: US industrial production rose by 0.9% in December 2024 compared to November
- Market impact: stocks of companies involved in manufacturing and mining may gain support as demand for their products rises steadily
Fundamental analysis
The increase in industrial production indicates stronger economic activity in key sectors, including the extraction and processing of raw materials, manufacturing of goods, and utilities. The December figures may partly reflect increased activity ahead of the holiday season, which boosts demand for goods and energy resources.
Industrial production is a crucial gauge of the broader state of the economy, as it influences key sectors such as energy, heavy engineering, and the motor industry. Companies reliant on domestic demand and exports are likely to deliver strong financial results which support their stocks.
US 30 technical analysis
The US 30 index has formed an uptrend, and the bulls will likely attempt to reach a new all-time high. However, according to the US 30 technical analysis, the growth potential is limited, and a sideways channel could form.
The following scenarios are considered for the US 30 price forecast:
- Pessimistic US 30 forecast: a breakout below the 43,055.0 support level could push the index down to 41,830.0
- Optimistic US 30 forecast: a breakout above the previously breached 43,385.0 resistance level could drive the price up to 44,545.0
US 500 technical analysis
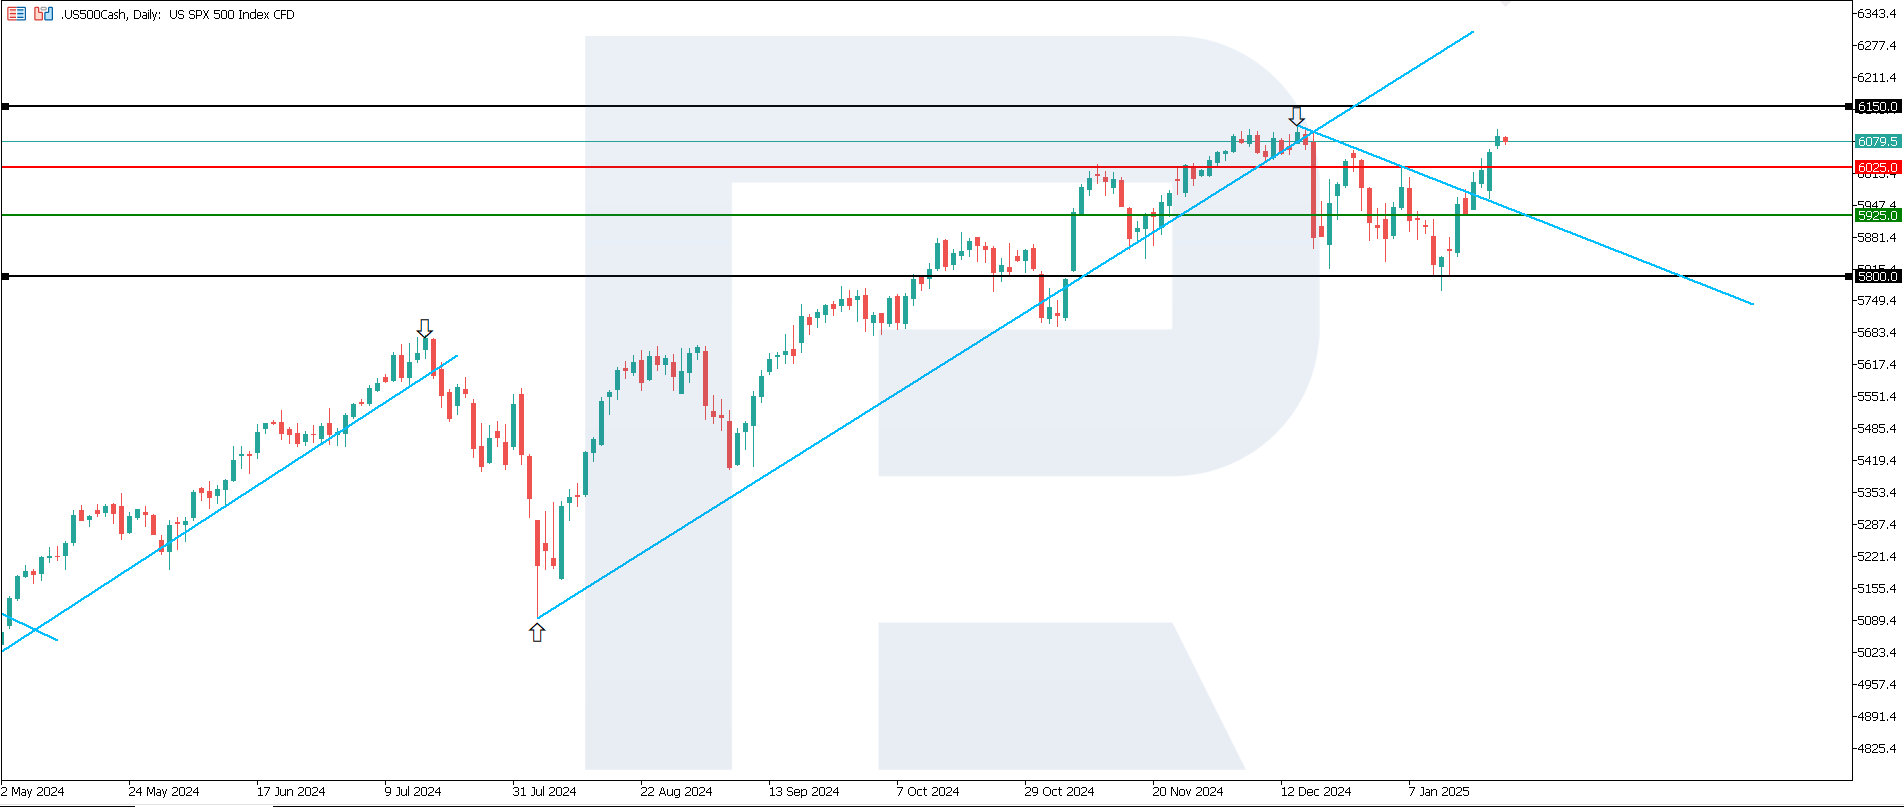
The US 500 stock index has broken above the 6,025.0 resistance level. An uptrend is expected to begin, potentially leading to a new all-time high. According to the US 500 technical analysis, the current trend is short-lived.
The following scenarios are considered for the US 500 price forecast:
- Pessimistic US 500 forecast: a breakout below the 5,925.0 support level could send the index down to 5,800.0
- Optimistic US 500 forecast: if the price consolidates above the previously breached resistance level at 6,025.0, it could climb to 6,150.0
US Tech technical analysis
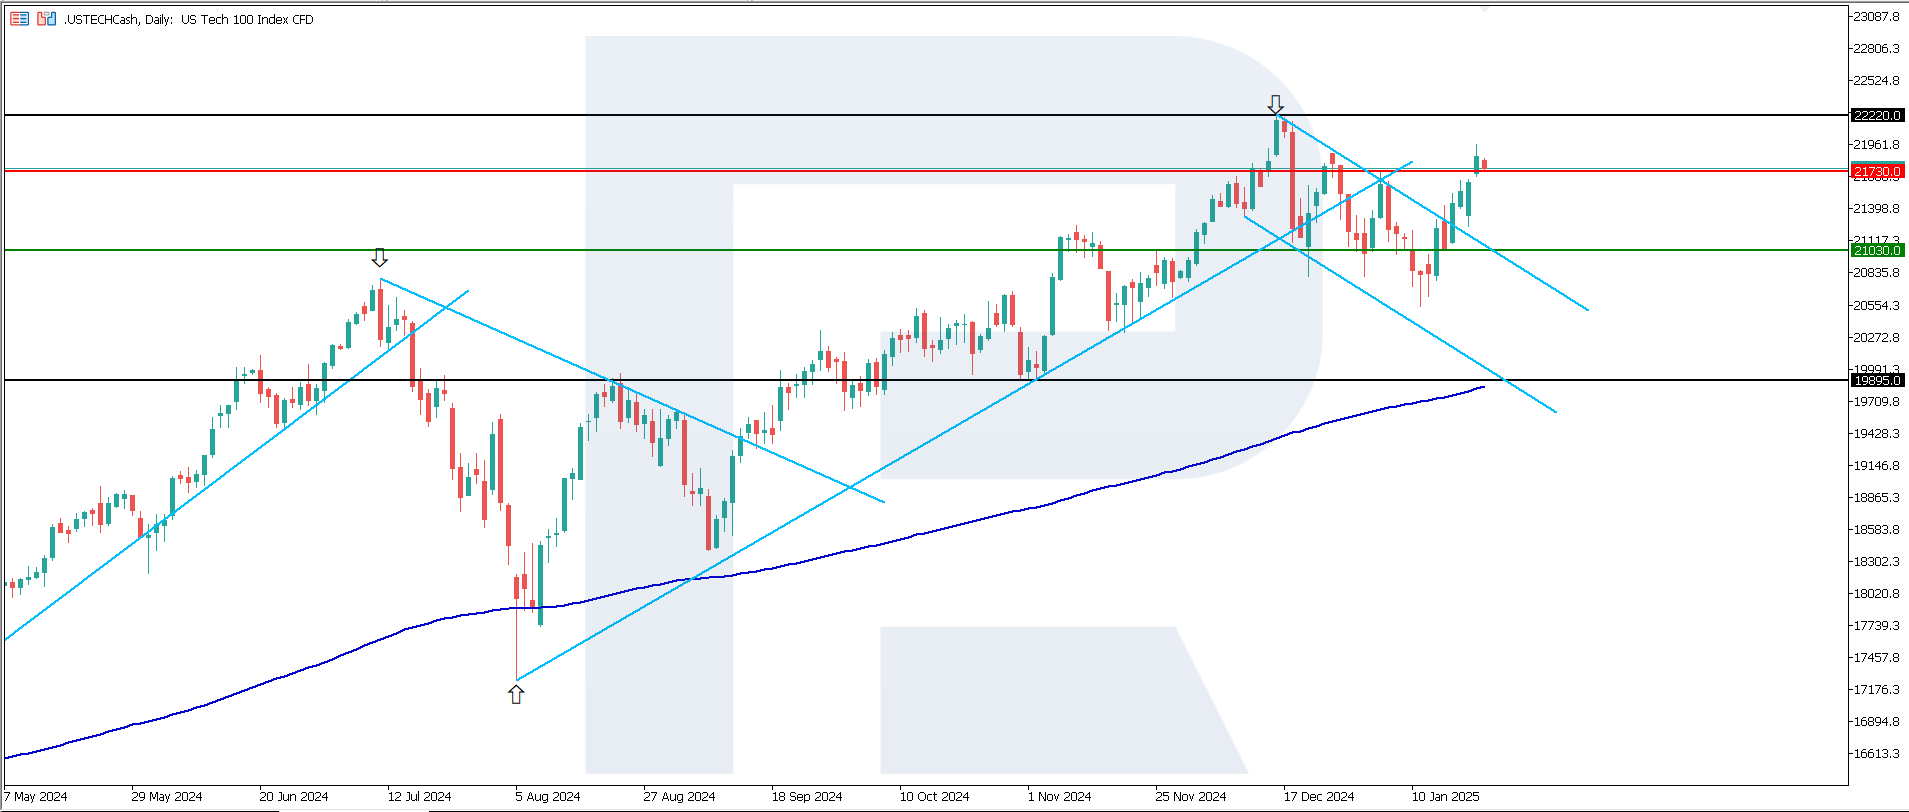
After exiting a descending channel, the US Tech stock index broke above the 21,730.0 resistance level. According to technical analysis, the index could form a sideways range after a period of short-term growth. However, the price is still unlikely to reach a new all-time high. If the quotes retrace below 21,730.0, a new downtrend could start.
The following scenarios are considered for the US Tech price forecast:
- Pessimistic US Tech forecast: a breakout below the 21,030.0 support level could push the index down to 19,895.0
- Optimistic US Tech forecast: consolidation above the previously breached 21,730.0 resistance level could drive the index up to 22,220.0
Asia index forecast: JP 225
- Recent data: the International Monetary Fund forecasts two interest rate hikes in 2025 and another two in 2026
- Market impact: higher rates mean more expensive lending, which may impact businesses, consumption, and Japan’s national debt
Fundamental analysis
Rate hikes may help strengthen the Japanese yen, making Japanese goods more expensive abroad and reducing the competitiveness of large exporters. A decline in export revenues will lead to a decline in the share prices of these companies.
Investors will consider these factors, revising their portfolios and showing preference for companies with stable financial positions. Elevated rates may slow domestic consumption and investment, putting additional pressure on shares of companies focused on the domestic market, such as retailers and real estate agencies.
JP 225 technical analysis
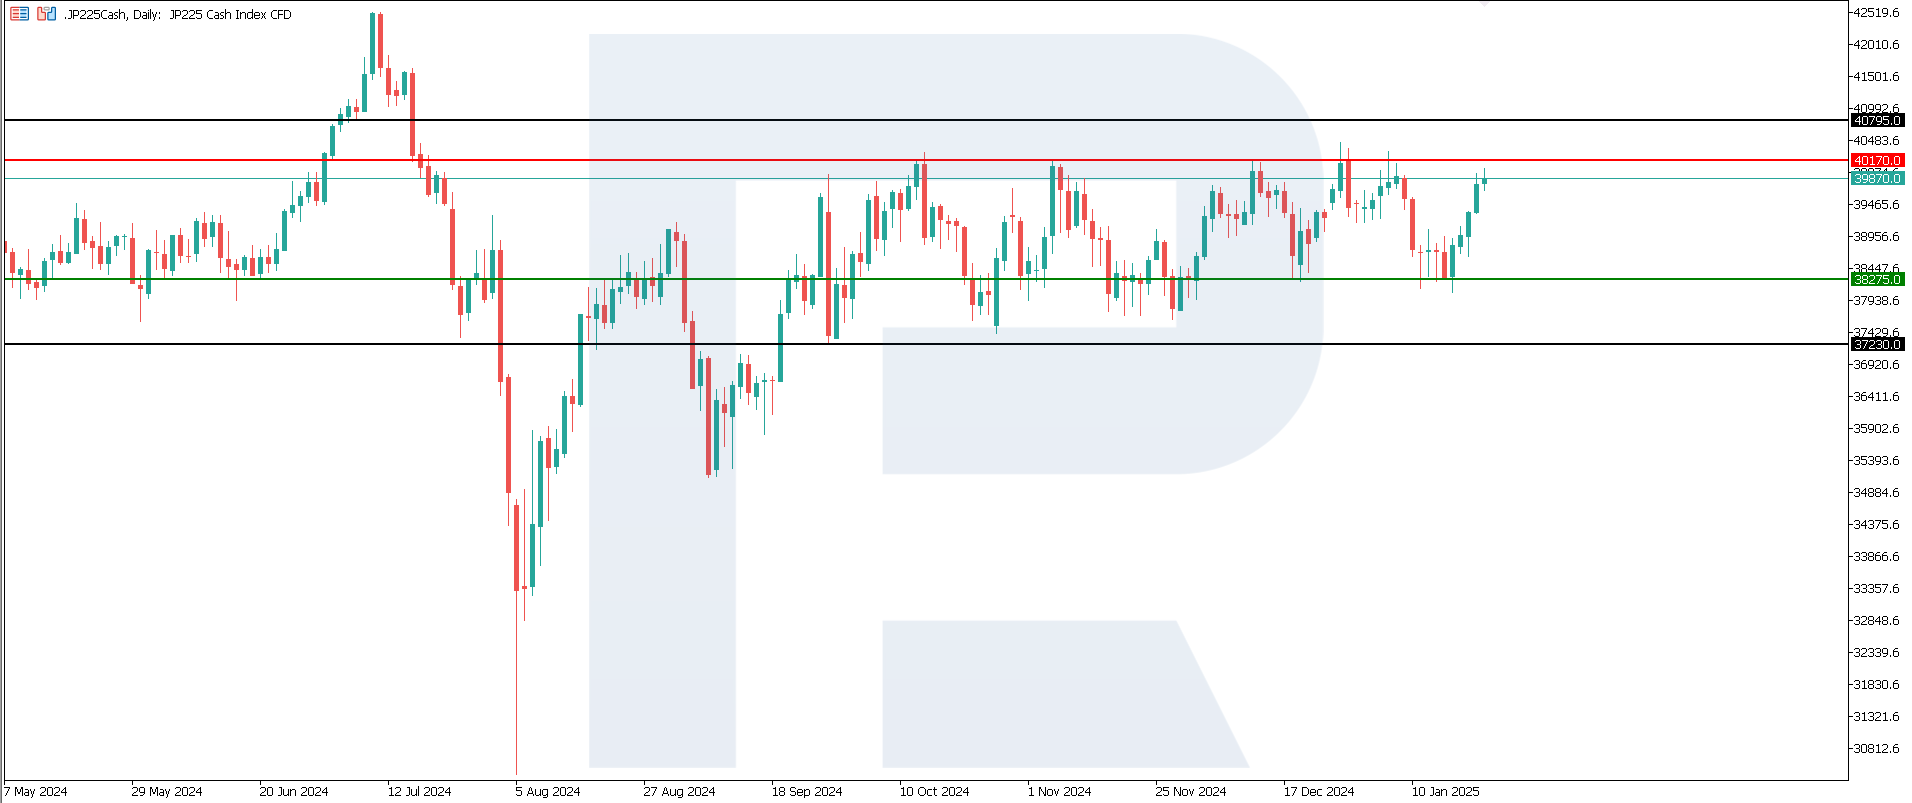
The JP 225 stock index is approaching the upper boundary of a sideways channel at the 40,170.0 resistance level. If this level is breached, the uptrend will resume. However, the likelihood of this scenario is relatively low, as the index has remained within the sideways channel for a prolonged period. According to the JP 225 technical analysis, the price will most likely rebound from the resistance level and decline towards the 38,275.0 support level.
The following scenarios are considered for the JP 225 price forecast:
- Pessimistic JP 225 forecast: a breakout below the 38,275.0 support level could push the index down to 37,230.0
- Optimistic JP 225 forecast: a breakout above the 40,170.0 resistance level could propel the index to 40,795.0
European index forecast: DE 40
- Recent data: the ZEW Economic Sentiment Index came in at 10.3 points in January
- Market impact: the drop in the ZEW index may be perceived as a signal of weak economic growth expectations, prompting caution among investors
Fundamental analysis
Germany’s stock market will likely face moderate pressure due to the lower ZEW indicator, especially in cyclical sectors. However, the positive index value and potential support from the ECB may limit the scale of negative reactions. Investors will closely follow future economic data to assess the resilience of the German economy.
A slowdown in economic confidence may reinforce arguments favouring a softer ECB policy, supporting market liquidity, and partially offsetting the negative impact. For this reason, the DE 40 index shows incremental growth.
DE 40 technical analysis
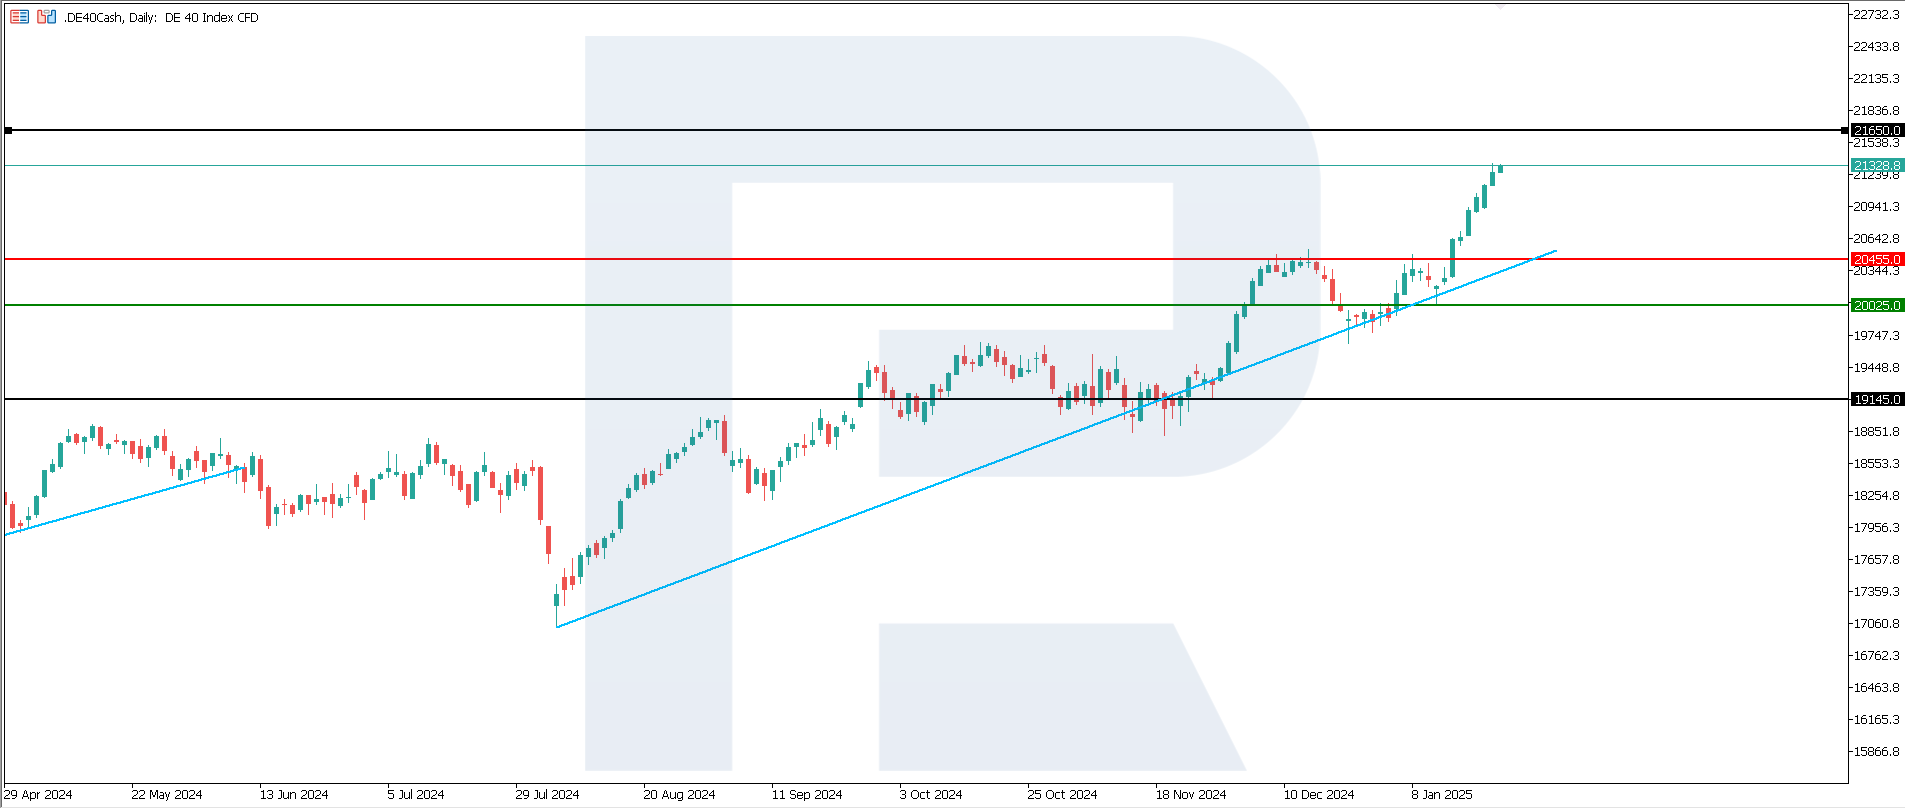
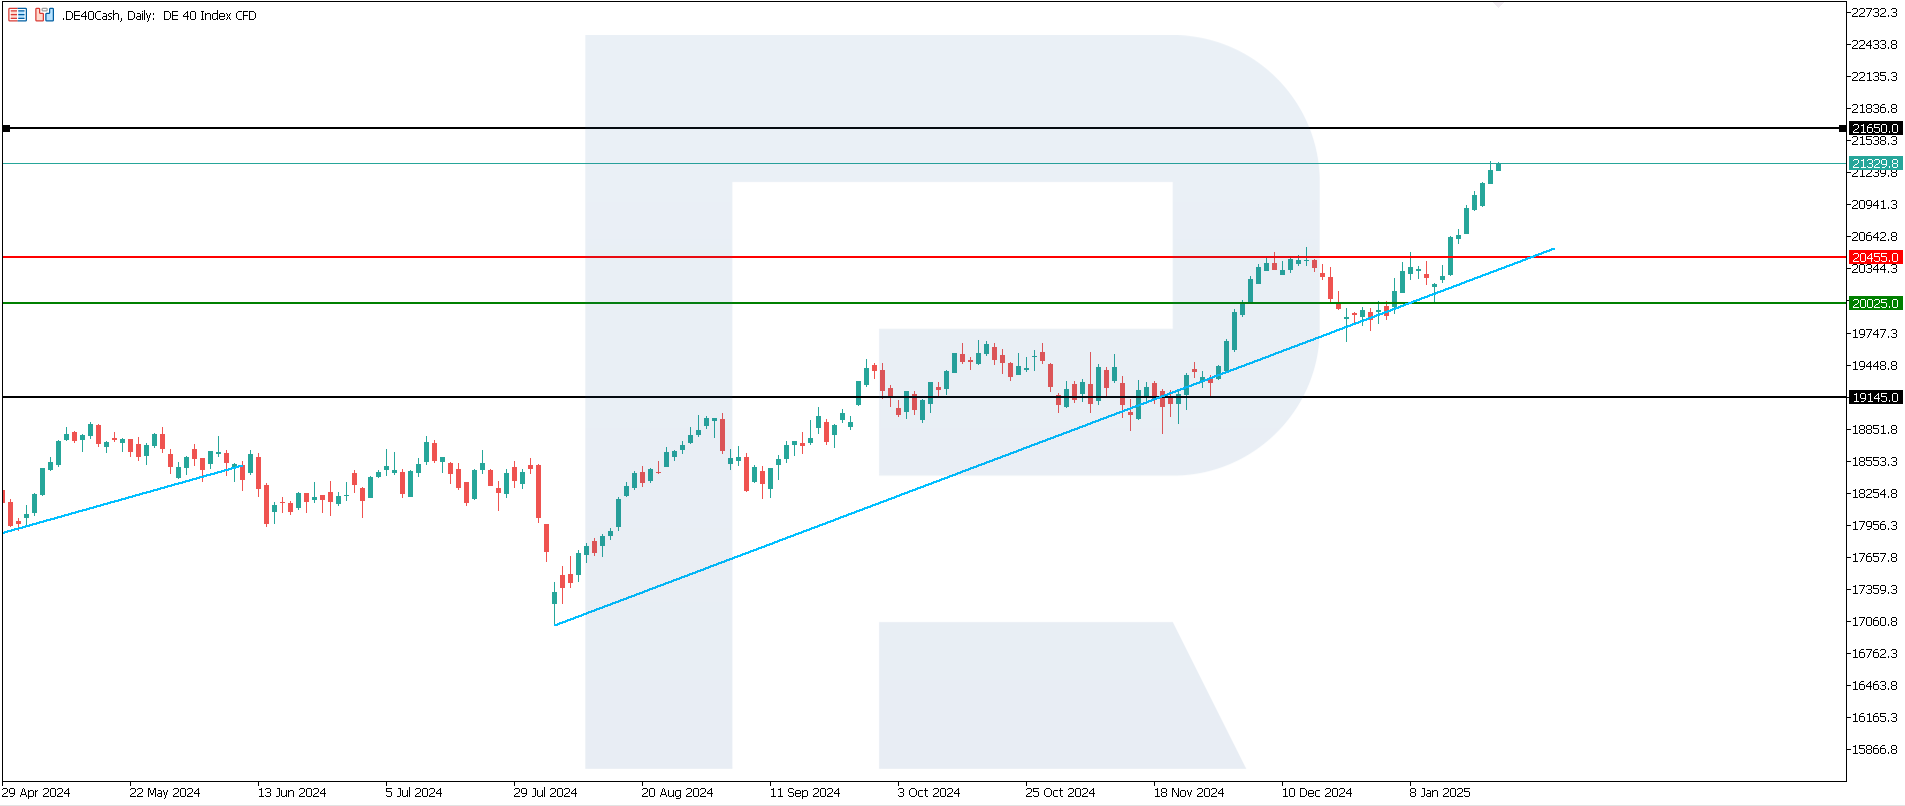
The DE 40 stock index has reached another all-time high. According to DE 40 technical analysis, a correction appears more likely, after which a new resistance level could form. Subsequently, it will become possible to forecast the duration of the current uptrend.
The following scenarios are considered for the DE 40 price forecast:
- Pessimistic DE 40 forecast: a breakout below the 20,025.0 support level could send the index down to 19,145.0
- Optimistic DE 40 forecast: if the price rises further above the previously breached 20,455.0 resistance level, it could climb to 21,650.0
Summary
Global stock markets remain optimistic. The US 30 and US 500 indices have the potential to reach new all-time highs within the established uptrend. The US Tech index has limited growth potential. The DE 40 index is expected to undergo a correction within the current uptrend. The JP 225 index may react to the Bank of Japan’s decision to raise the interest rate by exiting the sideways channel.
การคาดการณ์ที่นำเสนอในส่วนนี้จะสะท้อนให้เห็นความคิดเห็นส่วนตัวของผู้แต่งเท่านั้น และจะไม่สามารถถูกพิจารณาว่าเป็นแนวทางสำหรับการซื้อขาย RoboForex ไม่รับผิดชอบสำหรับผลลัพธ์การซื้อขายที่อ้างอิงตามคำแนะนำการซื้อขายที่อธิบายเอาไว้ในบทวิจารณ์การวิเคราะห์เหล่านี้

