World indices overview: news from US 30, US 500, US Tech, JP 225, and DE 40 for 21 January 2025
Stock indices continue to correct, with the DE 40 index leading the gains. Discover more in our analysis and forecast for global indices for 21 January 2025.
US indices forecast: US 30, US 500, US Tech
- Recent data: US Initial jobless claims came in at 217 thousand
- Market impact: the increase in claims may indicate the beginning of a labour market slowdown, which favourably impacts US stocks
Fundamental analysis
The actual reading of initial jobless claims was worse than expected (210 thousand) and higher than the previous figure of 201 thousand. The indicator shows the number of people filing for unemployment benefits for the first time during the week. A rise in claims may signal the onset of a labour market slowdown.
Robust data on the production sector and a relatively stable labour market (despite the rise in claims) may push the Federal Reserve to adopt a more cautious stance on further monetary policy easing. This could limit the potential for stock growth, especially in rate-sensitive sectors such as technology.
US 30 technical analysis
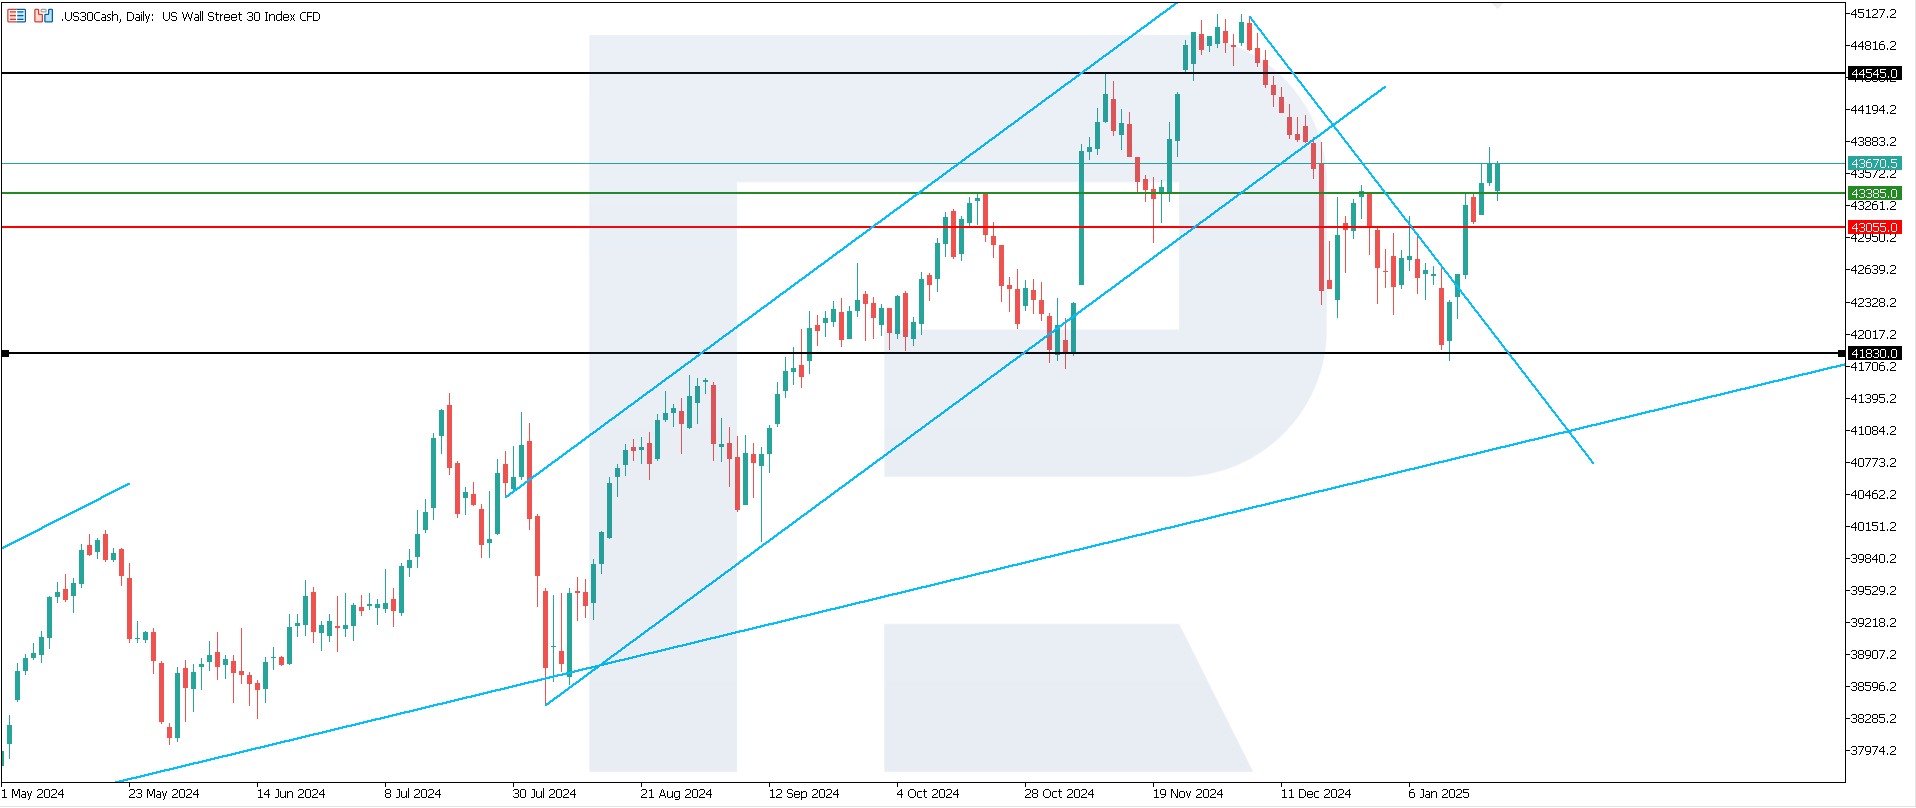
The US 30 stock index is experiencing the onset of an uptrend. A sideways channel could form in the asset. According to the US 30 technical analysis, the index will unlikely reach an all-time high in the near term.
The following scenarios are considered for the US 30 price forecast:
- Pessimistic US 30 forecast: a breakout below the 43,055.0 support level could push the index down to 41,830.0
- Optimistic US 30 forecast: a breakout above the previously breached 43,385.0 resistance level could drive the price up to 44,545.0
US 500 technical analysis
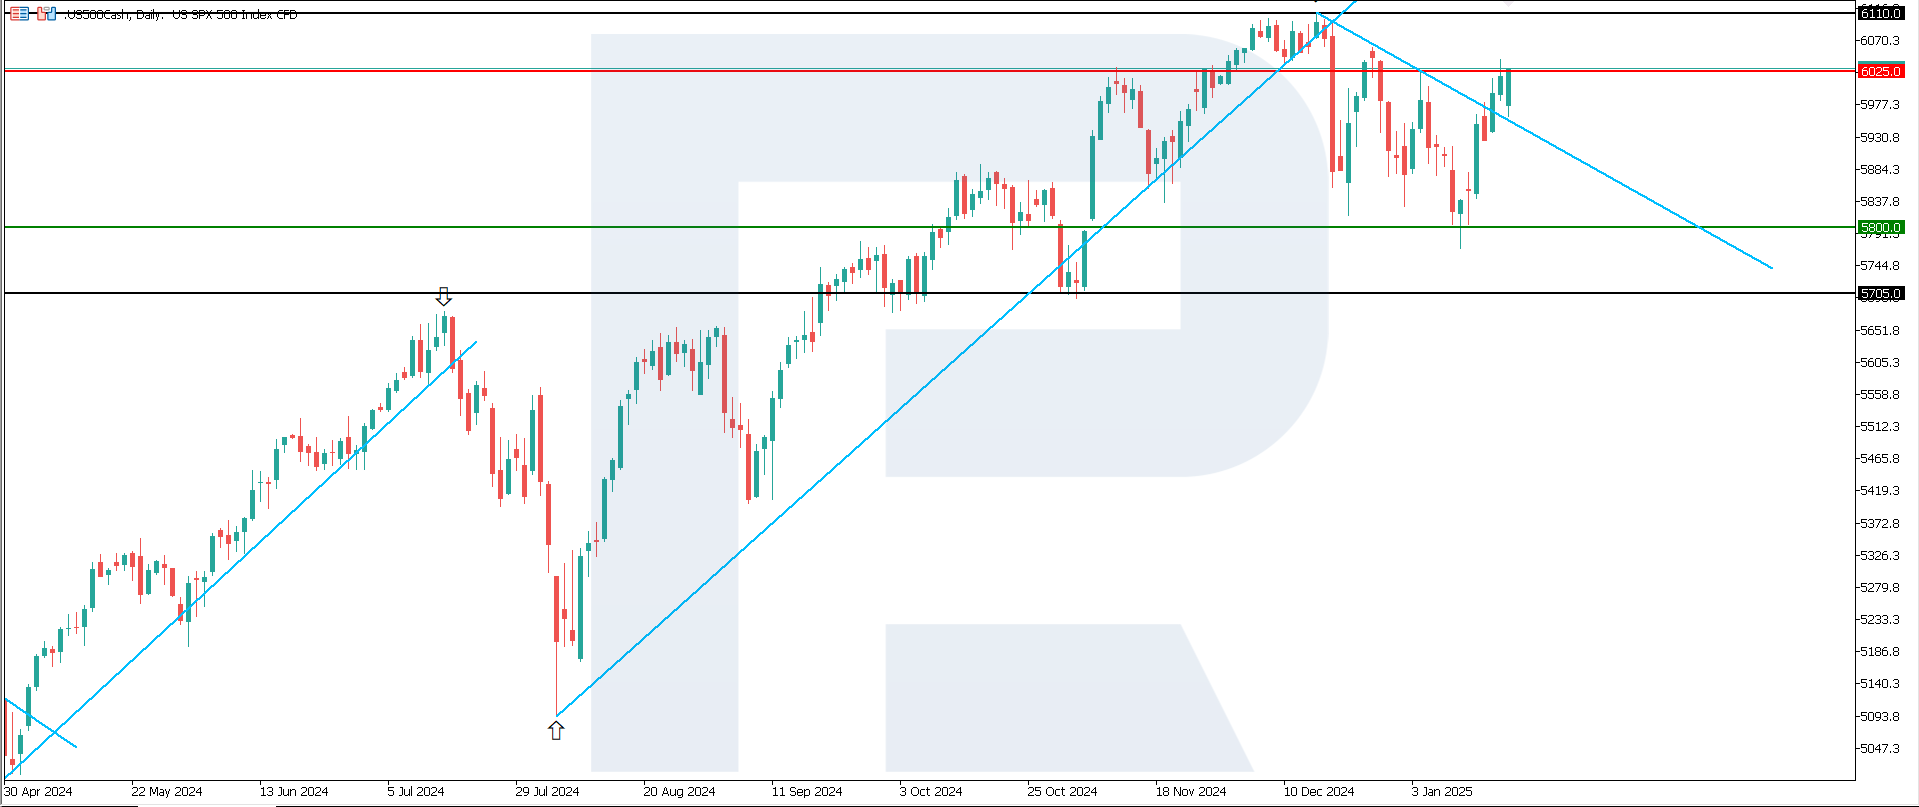
The US 500 stock index rose by 4.3% from its lows in mid-November 2024. The quotes approached the 6,025.0 resistance level, which will highly likely be breached. The nearest target is 6,110.0.
The following scenarios are considered for the US 500 price forecast:
- Pessimistic US 500 forecast: a breakout below the 5,800.0 support level could send the index down to 5,705.0
- Optimistic US 500 forecast: a breakout above the 6,025.0 resistance level could propel the index to 6,110.0
US Tech technical analysis
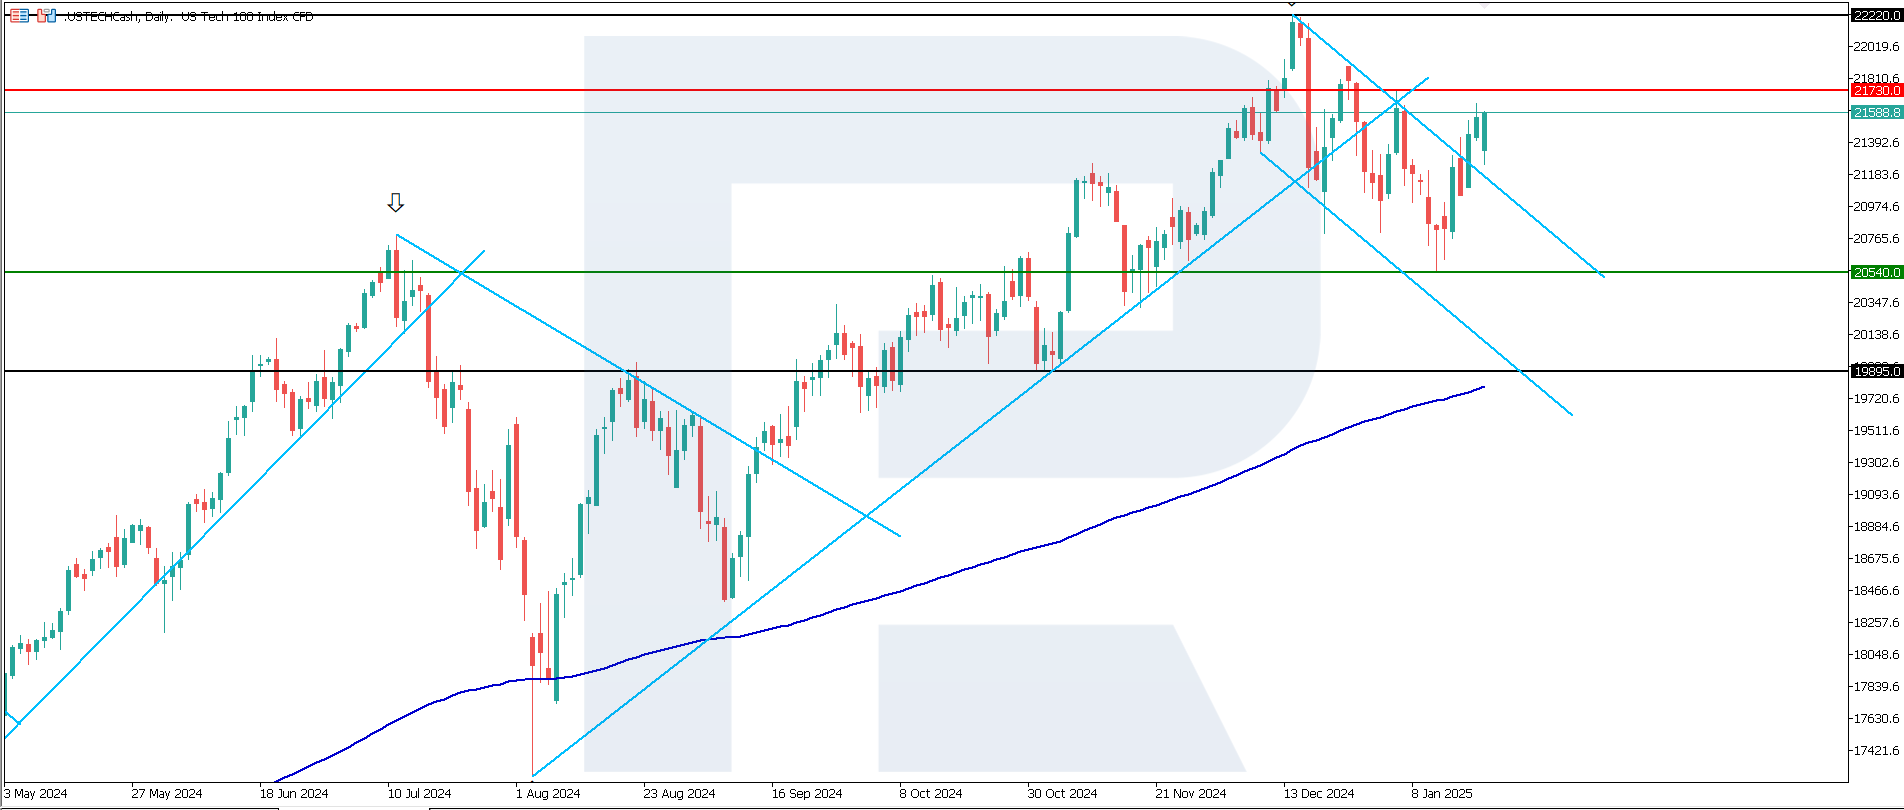
Following a 4.85% correction, the US Tech stock index exited a descending channel. In the near term, the downtrend could shift to a sideways channel. According to the US Tech technical analysis, the growth potential is relatively limited.
The following scenarios are considered for the US Tech price forecast:
- Pessimistic US Tech forecast: a breakout below the 20,540.0 support level could push the index down to 19,895.0
- Optimistic US Tech forecast: a breakout above the 21,730.0 resistance level could drive the index up to 22,220.0
Asia index forecast: JP 225
- Recent data: overnight index swaps showed a 99% likelihood of a Bank of Japan interest rate hike at its meeting on 23-24 January
- Market impact: a rapid change in the Bank of Japan’s monetary policy may increase volatility in the stock market in the near term
Fundamental analysis
The Bank of Japan traditionally adhered to an ultra-loose monetary policy, including negative rates and yield curve control. Rate hikes may signal the beginning of policy normalisation due to inflationary pressures and the weakening of the yen.
The banking sector could benefit from rate increases, as banks’ interest margins may expand. This could support the stocks of Japanese banks and insurance companies. However, if higher rates lead to reduced lending and consumption, they may negatively impact sectors focused on the domestic market.
JP 225 technical analysis
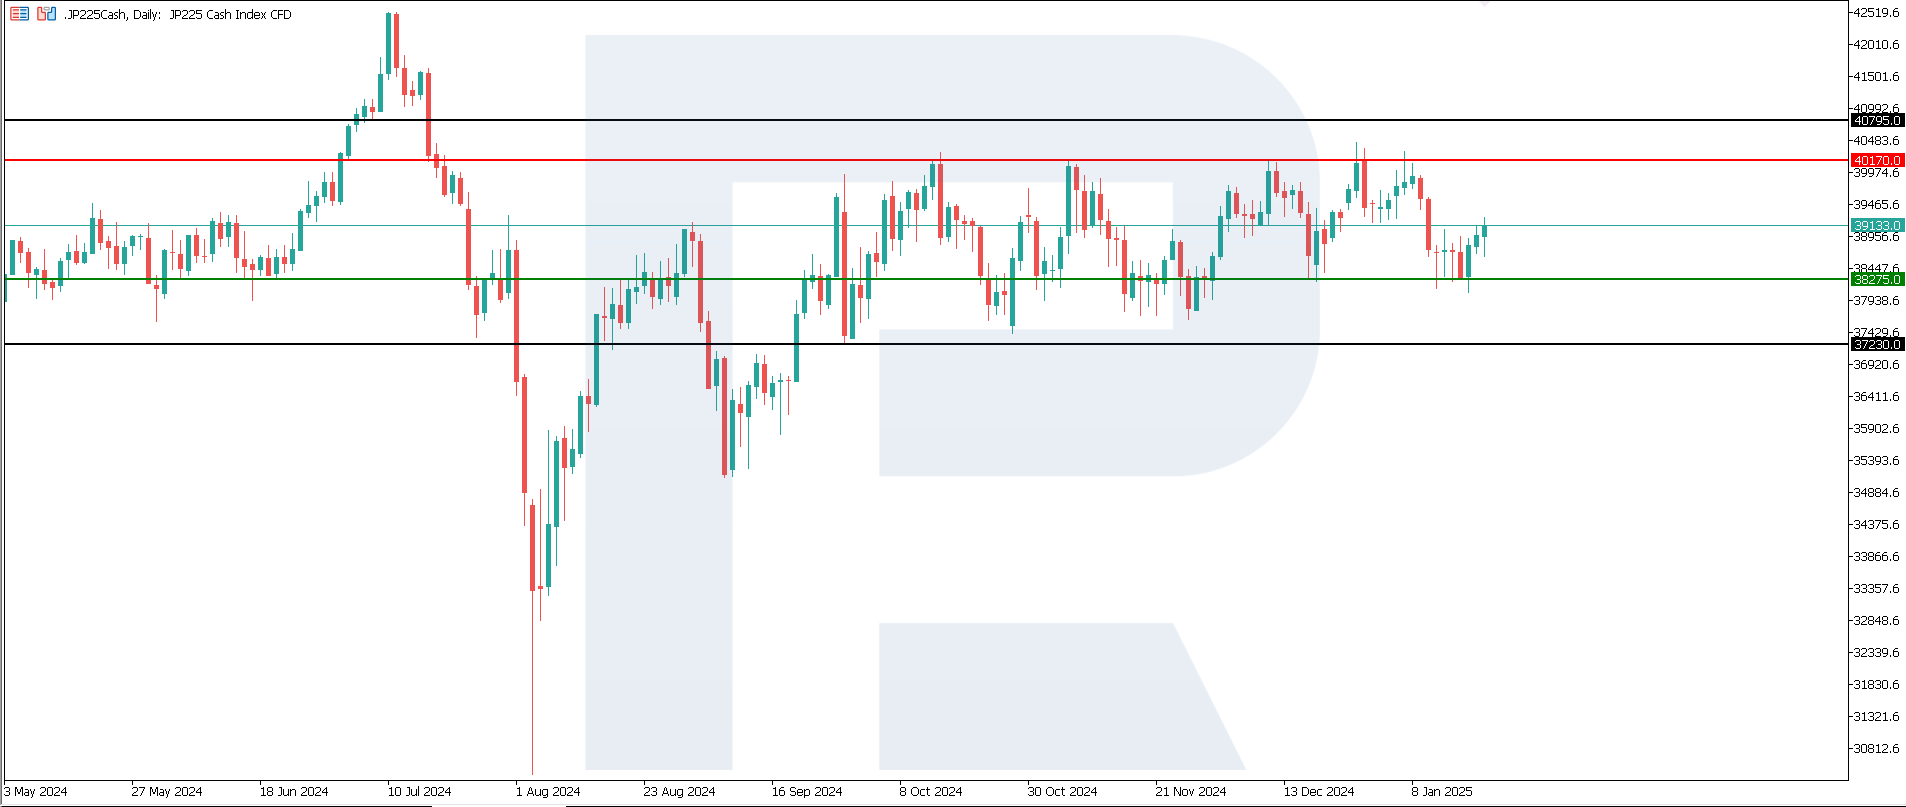
The JP 225 stock index is trading within a sideways channel, formed between its resistance and support levels. According to the JP 225 technical analysis, this range suits both buyers and sellers. The price has rebounded from the 38,275.0 support level and is likely to rise to 40,170.0.
The following scenarios are considered for the JP 225 price forecast:
- Pessimistic JP 225 forecast: a breakout below the 38,275.0 support level could drive the index down to 37,230.0
- Optimistic JP 225 forecast: a breakout above the 40,170.0 resistance level could push the index to 40,795.0
European index forecast: DE 40
- Recent data: Germany’s GDP decreased by 0.2%
- Market impact: the contraction in Germany’s GDP is putting pressure on stocks in key export industries
Fundamental analysis
A GDP decline over two consecutive years may indicate economic stagnation, characterised by the absence of significant growth or sharp declines. This may be attributed to a slowdown in key sectors, such as automobile manufacturing, machine engineering, and energy, which play crucial roles in the German economy.
Export-dependent companies (including automakers BMW, Daimler, and Volkswagen) may face lower revenues due to weakened demand, potentially leading to a drop in share prices. However, expectations of economic stimulus and the ECB’s loose monetary policy could limit the overall negative effect on the stock market.
DE 40 technical analysis
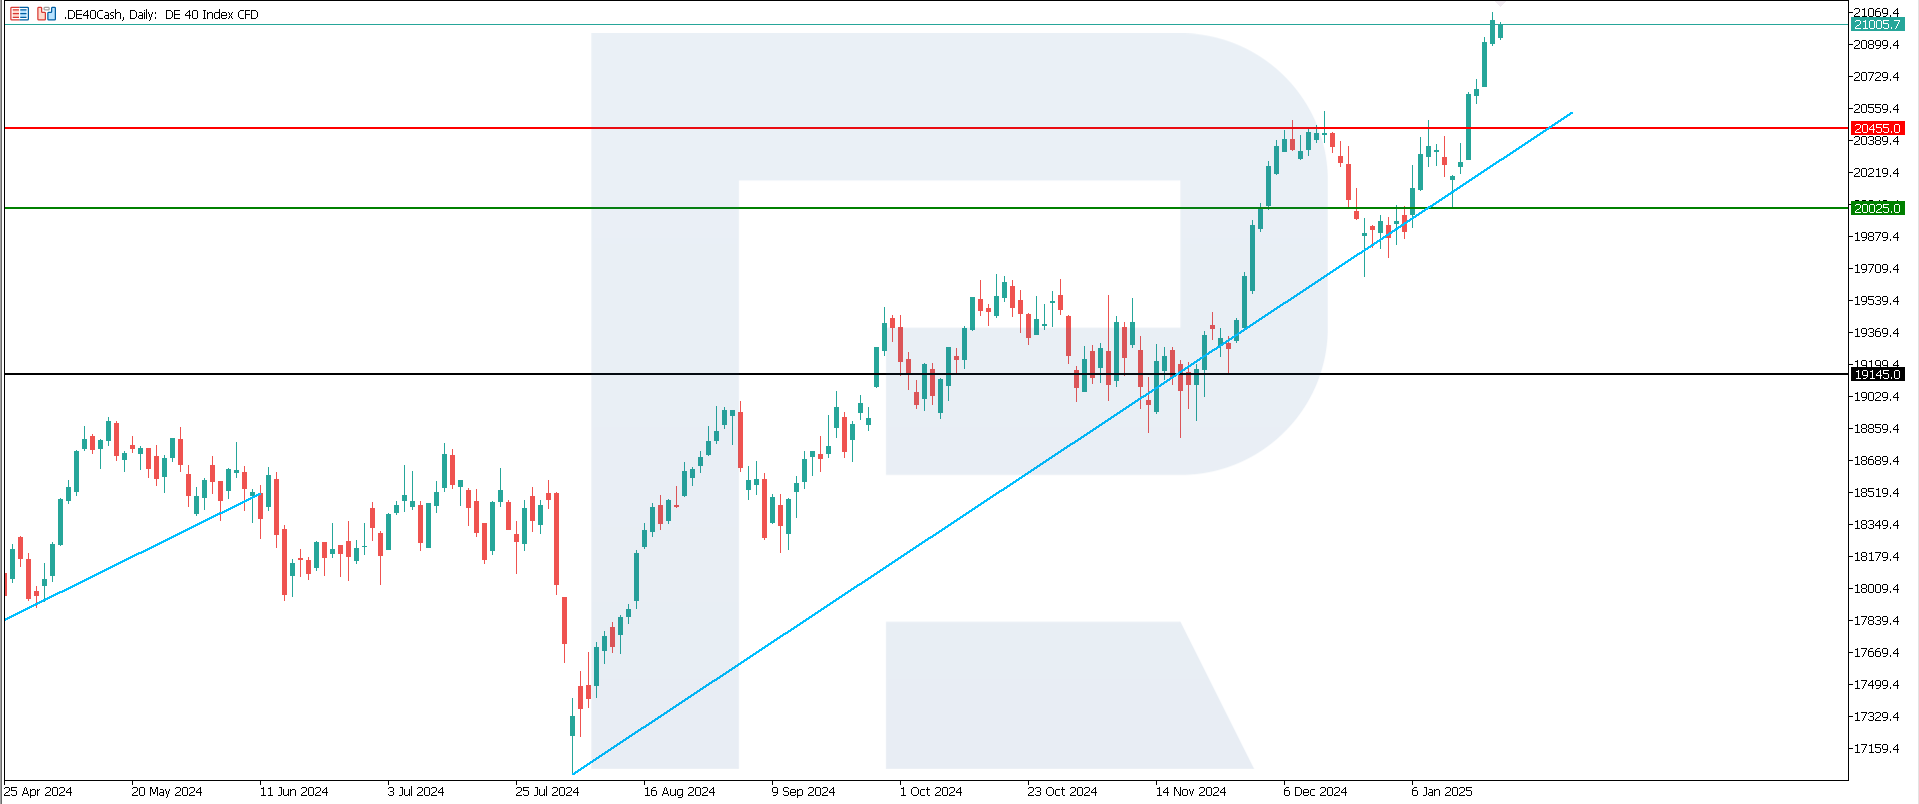
The DE 40 stock index has reached a new all-time high within an uptrend. According to the DE 40 technical analysis, if the price consolidates above 20,455.0, the uptrend will likely continue. A retreat below this level will create conditions for a correction.
The following scenarios are considered for the DE 40 price forecast:
- Pessimistic DE 40 forecast: a breakout below the 20,025.0 support level could send the index down to 19,145.0
- Optimistic DE 40 forecast: if the price consolidates above the previously breached 20,455.0 resistance level, it could climb to 20,960.0
Summary
A correction in the US stock indices has not yet materialised, increasing the likelihood of sideways channel formation. The DE 40 stock index is in a strong uptrend, likely to persist in the medium term. However, a short-term correction is possible. The JP 225 stock index continues to trade within a long-term sideways channel with no clear prospects of breaking out.
การคาดการณ์ที่นำเสนอในส่วนนี้จะสะท้อนให้เห็นความคิดเห็นส่วนตัวของผู้แต่งเท่านั้น และจะไม่สามารถถูกพิจารณาว่าเป็นแนวทางสำหรับการซื้อขาย RoboForex ไม่รับผิดชอบสำหรับผลลัพธ์การซื้อขายที่อ้างอิงตามคำแนะนำการซื้อขายที่อธิบายเอาไว้ในบทวิจารณ์การวิเคราะห์เหล่านี้

