World indices overview: news from US 30, US 500, US Tech, JP 225, and DE 40 for 16 January 2025
The US inflation release provided support to global stock indices. Find out more in our analysis and forecast for global indices for 16 January 2025.
US indices forecast: US 30, US 500, US Tech
- Recent data: the US core CPI rose 3.2% year-on-year
- Market impact: the current inflation data allows investors to expect further easing of US Federal Reserve monetary policy, which has a positive impact on the stock market
Fundamental analysis
According to the Bureau of Labor Statistics, the core CPI, excluding food and energy costs, increased by 0.2%, following a 0.3% rise for four consecutive months. It has risen by 3.2% from the previous year.
The fall in core inflation and a strong labour market send mixed signals, which could support stock market growth, particularly in the technology and consumer discretionary sectors, if the Federal Reserve announces a rate cut.
US 30 technical analysis
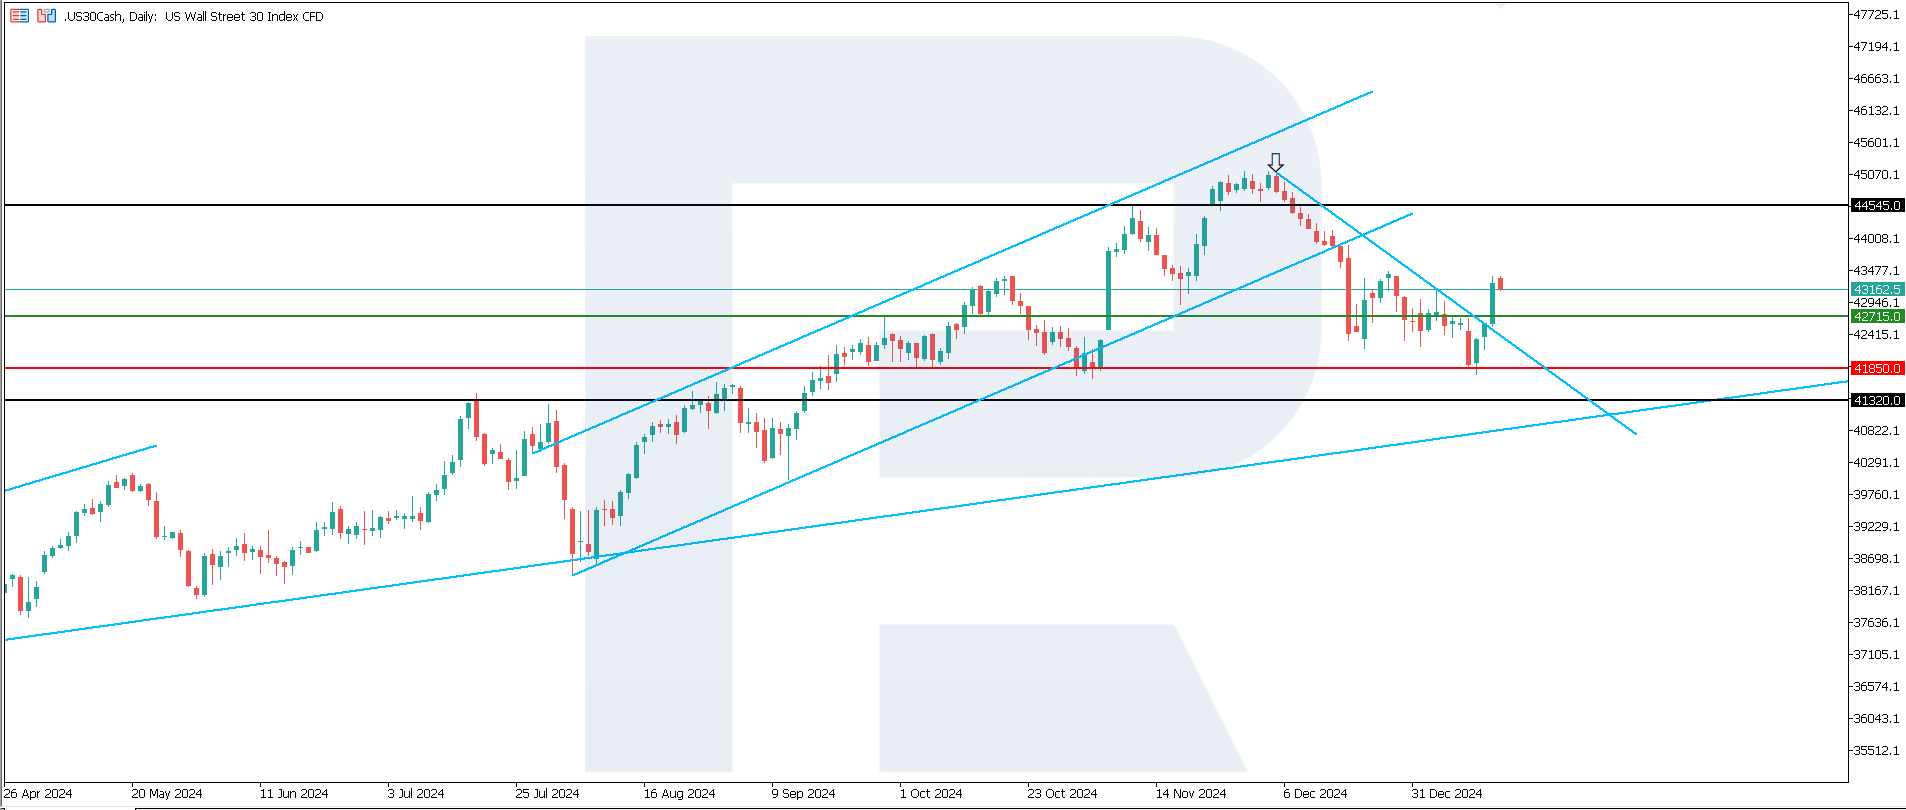
The downtrend in the US 30 stock index was subdued after the price broke above the 42,715.0 resistance level. The index will most likely consolidate above this level. However, a new all-time high is not expected, as growth may be limited.
The following scenarios are considered for the US 30 price forecast:
- Pessimistic US 30 forecast: a breakout below the 41,850.0 support level could push the index down to 41,320.0
- Optimistic US 30 forecast: a breakout above the previously breached 42,715.0 resistance level could drive the price up to 44,545.0
US 500 technical analysis
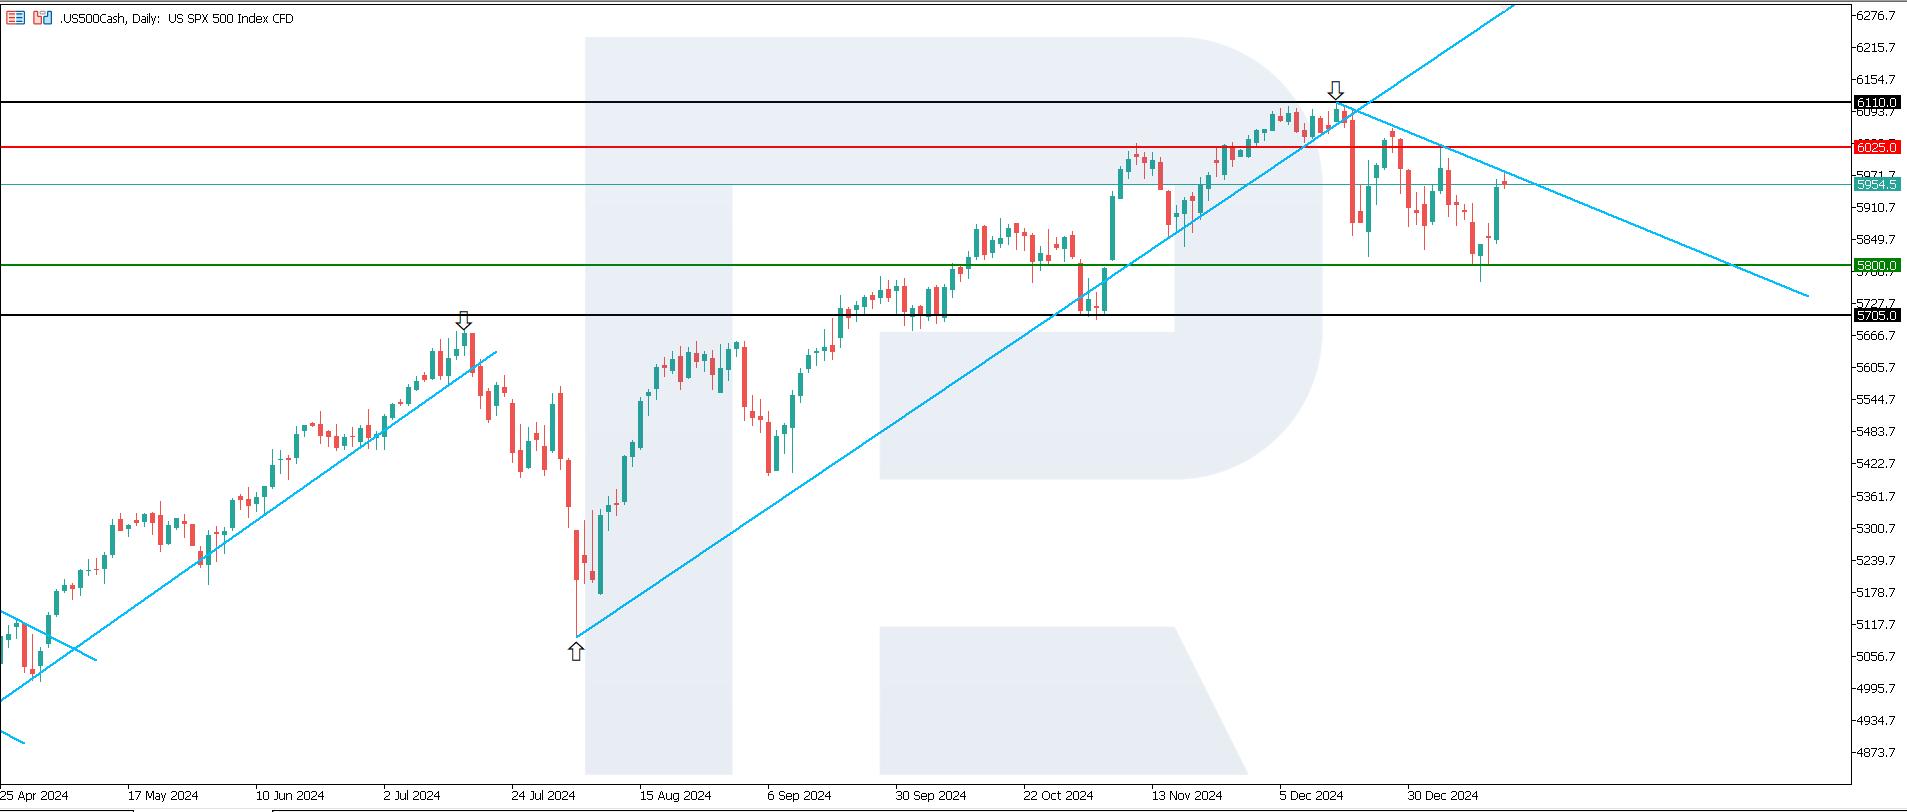
The US 500 stock index has risen 3.8% from the lows seen in November last year. The downtrend persists but is much weaker. The bulls will likely break above the 6,025.0 resistance level, with the nearest target at 6,110.0.
The following scenarios are considered for the US 500 price forecast:
- Pessimistic US 500 forecast: a breakout below the 5,800.0 support level could send the index down to 5,705.0
- Optimistic US 500 forecast: a breakout above the 6,025.0 resistance level could propel the index to 6,110.0
US Tech technical analysis
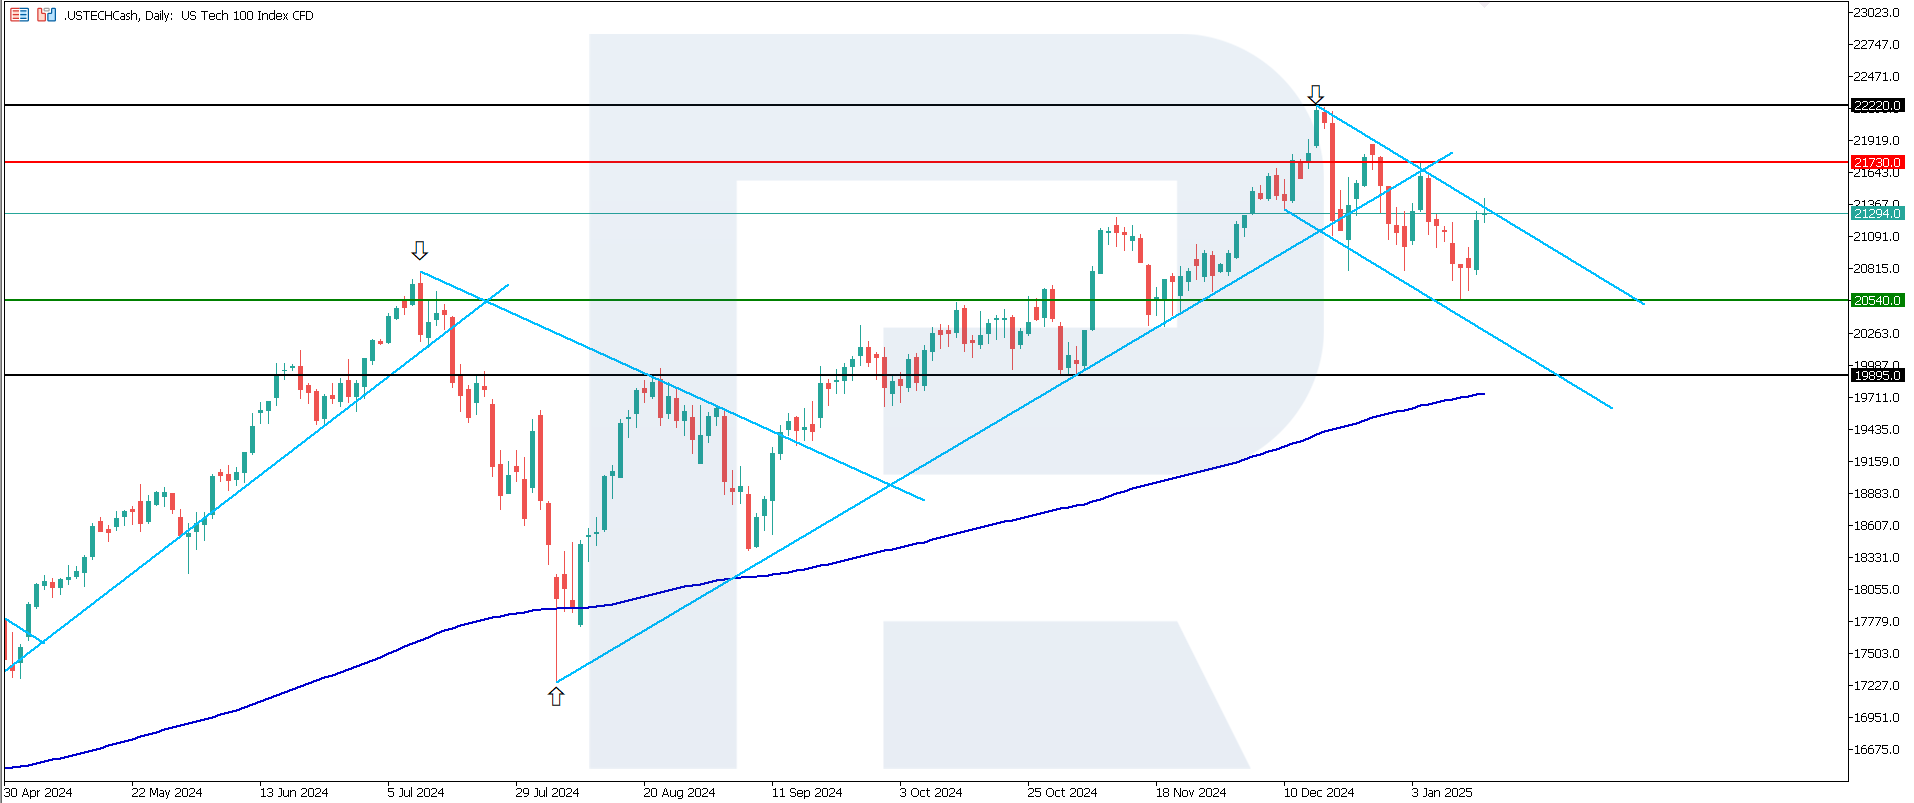
Following a 3.65% correction, the US Tech stock index remains within a descending channel. In the near term, the downtrend could shift to a sideways channel. According to the US Tech technical analysis, the growth potential is relatively limited.
The following scenarios are considered for the US Tech price forecast:
- Pessimistic US Tech forecast: a breakout below the 20,540.0 support level could push the index down to 19,895.0
- Optimistic US Tech forecast: a breakout above the 21,730.0 resistance level could drive the index up to 22,220.0
Asia index forecast: JP 225
- Recent data: Japan’s Producer Price Index (PPI) rose 3.8% year-on-year
- Market impact: the stable annual PPI shows that producers continue to face pressure from high raw material and energy costs, which may negatively impact their profits and investor sentiment in the stock market
Fundamental analysis
If a slowdown in the PPI leads to reduced corporate profits in commodity and manufacturing-related sectors, this could put pressure on the stock market. This indicator points to easing short-term inflationary pressures in the manufacturing industry, which could positively influence the Japanese stock market, especially in the export and consumer sectors.
If slower growth in producer prices affects the consumer market, this could support demand from consumers. Businesses focused on domestic consumption will benefit, strengthening their financial position.
JP 225 technical analysis
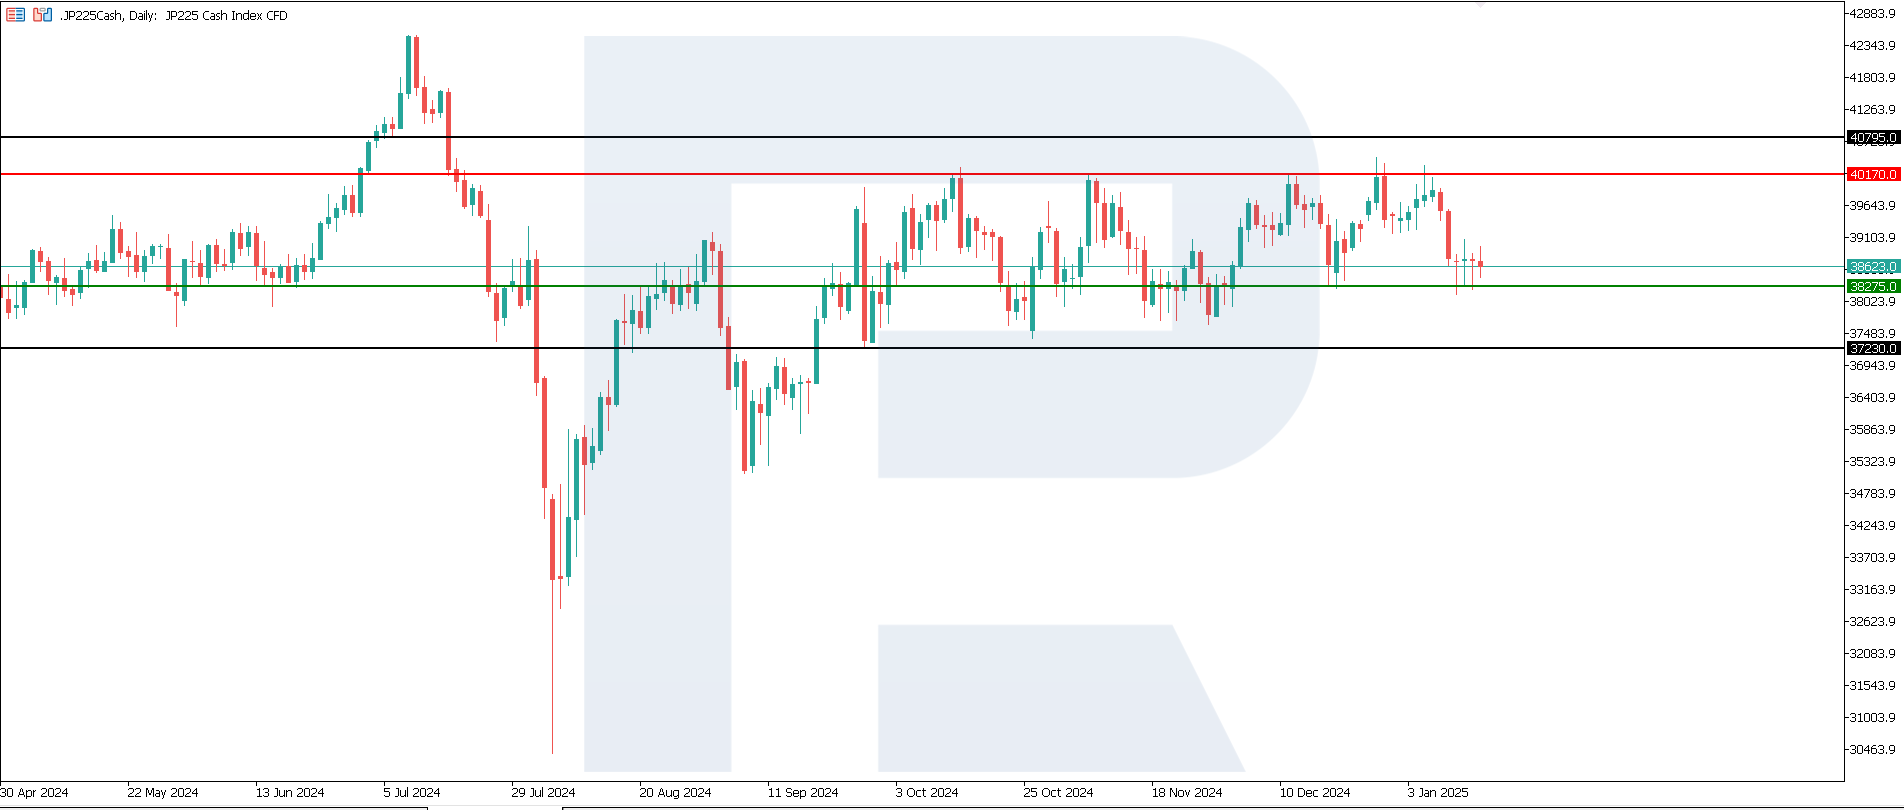
The JP 225 stock index continues to trade within a sideways channel, formed between its resistance and support levels. According to the JP 225 technical analysis, this range suits both buyers and sellers. A directional trend is unlikely to form in the medium term.
The following scenarios are considered for the JP 225 price forecast:
- Pessimistic JP 225 forecast: a breakout below the 38,275.0 support level could drive the index down to 37,230.0
- Optimistic JP 225 forecast: a breakout above the 40,170.0 resistance level could push the index to 40,795.0
European index forecast: DE 40
- Recent data: Germany’s CPI came in at 2.6% year-on-year
- Market impact: companies involved in the consumer goods sector may see higher revenues, which could boost demand for their shares
Fundamental analysis
The annual CPI shows rising inflation, which has reached a higher level but remains relatively moderate compared to all-time highs. The uptick in inflation will allow the ECB to maintain its rate-cutting stance or keep rates at a low level, supporting the stock market. This was the main reason behind the DE 40 stock index growth.
The CPI data indicates moderate inflation growth, which the market may perceive positively in the short term, especially given the ECB’s accommodative policy. However, if inflation accelerates, this will increase volatility and lead to a reassessment of monetary policy expectations, creating risks for the German stock market.
DE 40 technical analysis
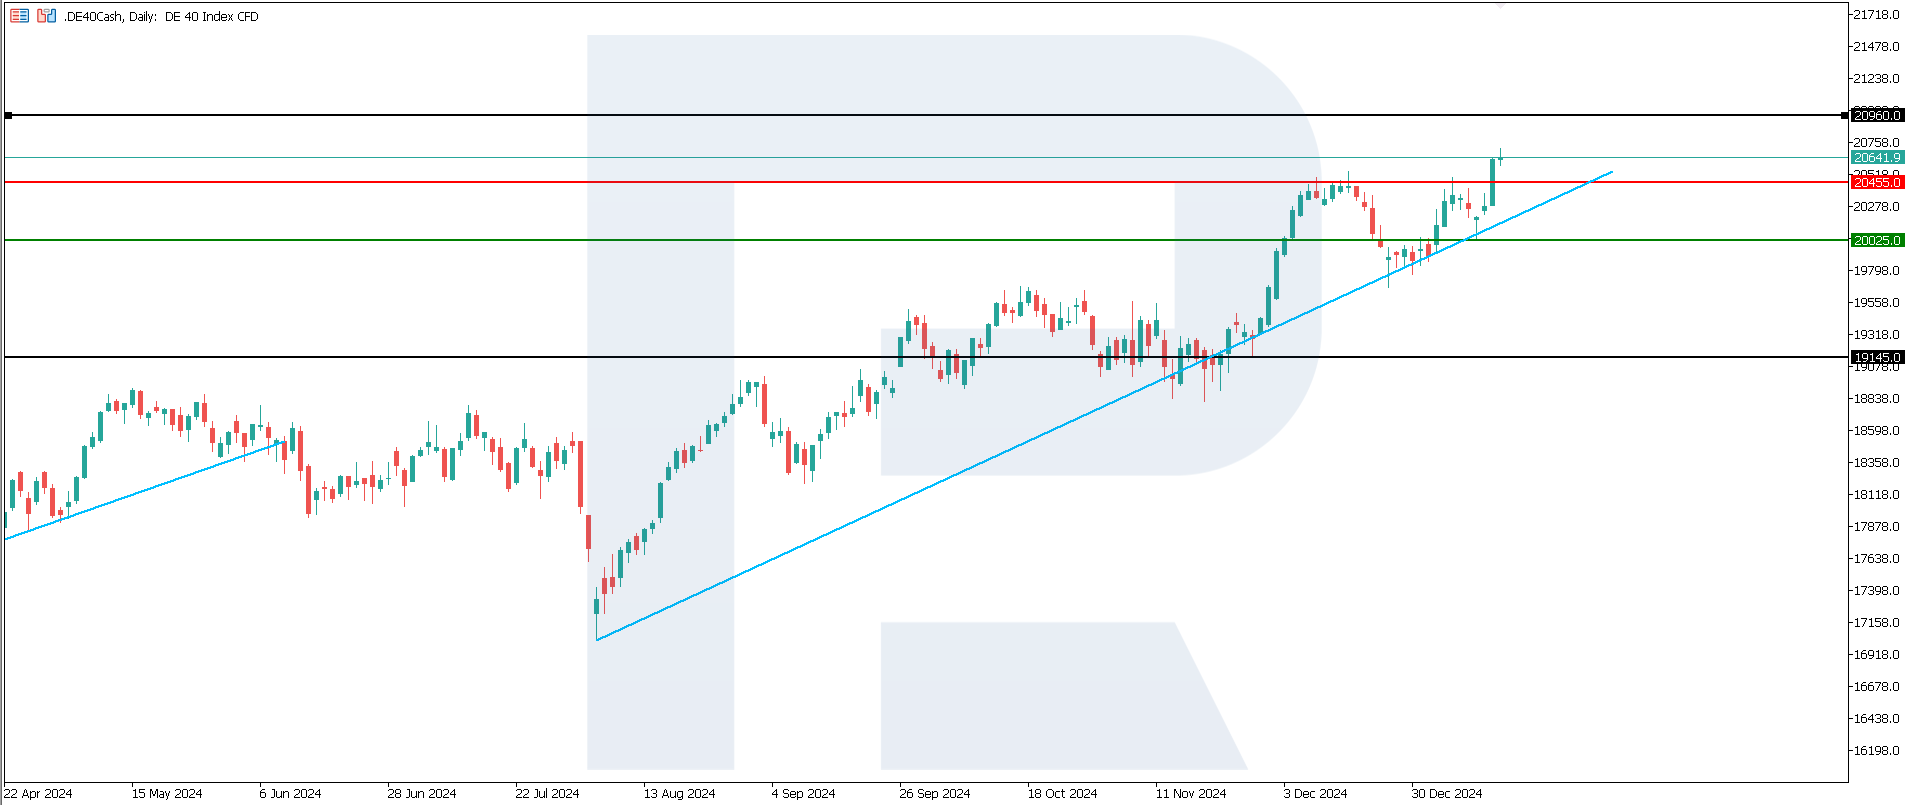
The DE 40 stock index reached a new all-time high within an uptrend. According to the DE 40 technical analysis, if prices consolidate above 20,455.0, the uptrend will continue in the short term. A retreat below this level will create conditions for a potential trend reversal.
The following scenarios are considered for the DE 40 price forecast:
- Pessimistic DE 40 forecast: a breakout below the 20,025.0 support level could send the index down to 19,145.0
- Optimistic DE 40 forecast: if the price consolidates above the previously breached 20,455.0 resistance level, it could climb to 20,960.0
Summary
The DE 40 was the only global stock index to hit its all-time high on positive CPI news. Similar data from the US triggered a correction and trend reversal in the US 30, US 500, and US Tech indices. Japan’s JP 225 continues to trade within a sideways channel without prospects of exiting it. In future, comments from the US Federal Reserve leadership regarding future monetary policy may impact trends in global stock indices.
การคาดการณ์ที่นำเสนอในส่วนนี้จะสะท้อนให้เห็นความคิดเห็นส่วนตัวของผู้แต่งเท่านั้น และจะไม่สามารถถูกพิจารณาว่าเป็นแนวทางสำหรับการซื้อขาย RoboForex ไม่รับผิดชอบสำหรับผลลัพธ์การซื้อขายที่อ้างอิงตามคำแนะนำการซื้อขายที่อธิบายเอาไว้ในบทวิจารณ์การวิเคราะห์เหล่านี้

