Daily technical analysis & forecast for 14 February 2025 (EURUSD, USDJPY, GBPUSD, AUDUSD, USDCAD, XAUUSD, and Brent)
EURUSD forecast
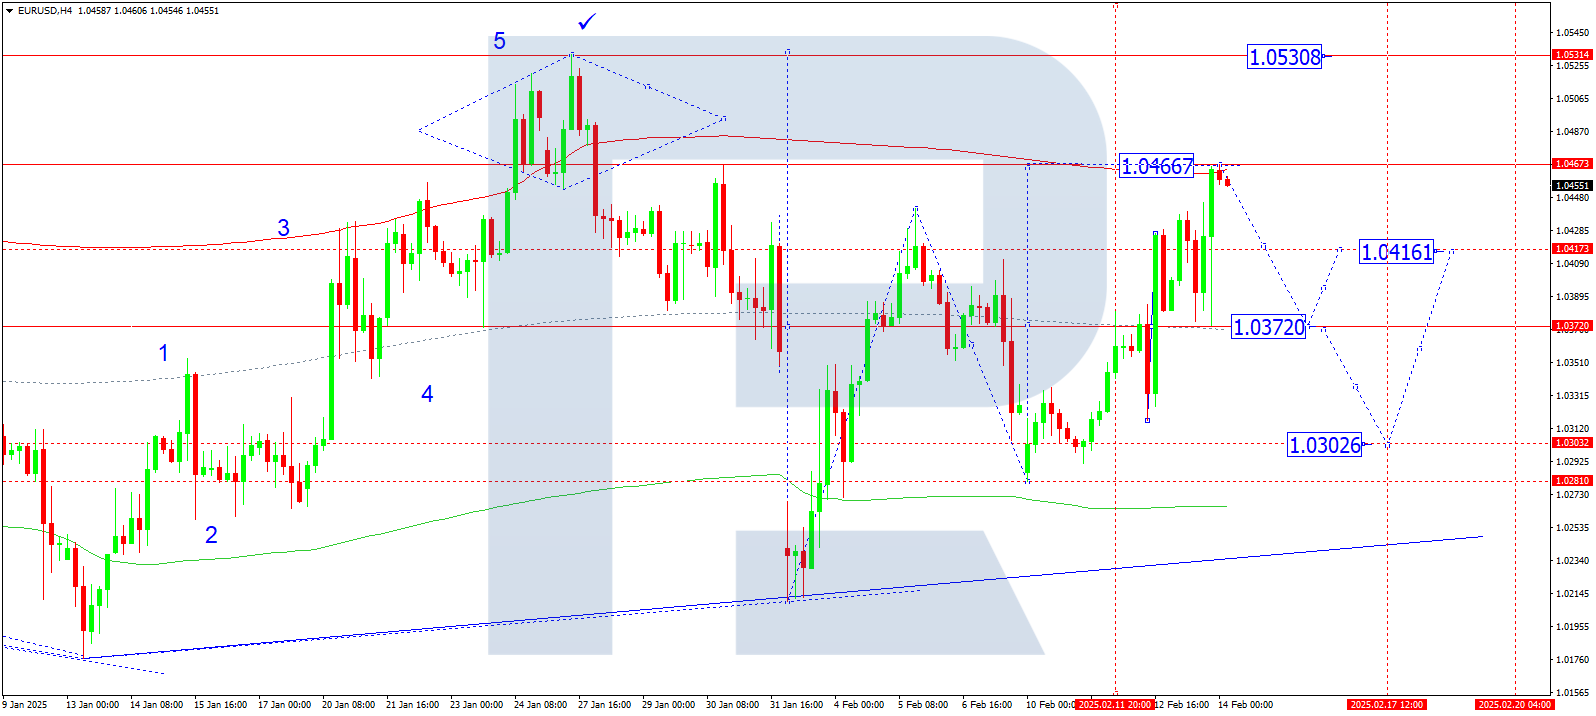
On the H4 chart, EURUSD completed a growth wave to 1.0444, followed by a correction to 1.0372. After finding support at this level, the market formed a growth wave towards 1.0466, reaching the target level. Currently, a consolidation range is forming below 1.0466. A downward breakout may initiate a decline towards 1.0372. Later, a new growth wave towards 1.0416 may develop.
Technically, this scenario is confirmed by the Elliott wave structure and the growth wave matrix with a pivot point at 1.0372, considered a key level for EURUSD. Currently, the market has formed a consolidation range around the central line of the price Envelope at 1.0372, and after breaking upwards, it completed a growth wave towards the upper boundary at 1.0466. A downward move towards the central line at 1.0372 is expected.
Technical indicators for today's EURUSD forecast suggest the probability of a decline towards 1.0372.
USDJPY forecast
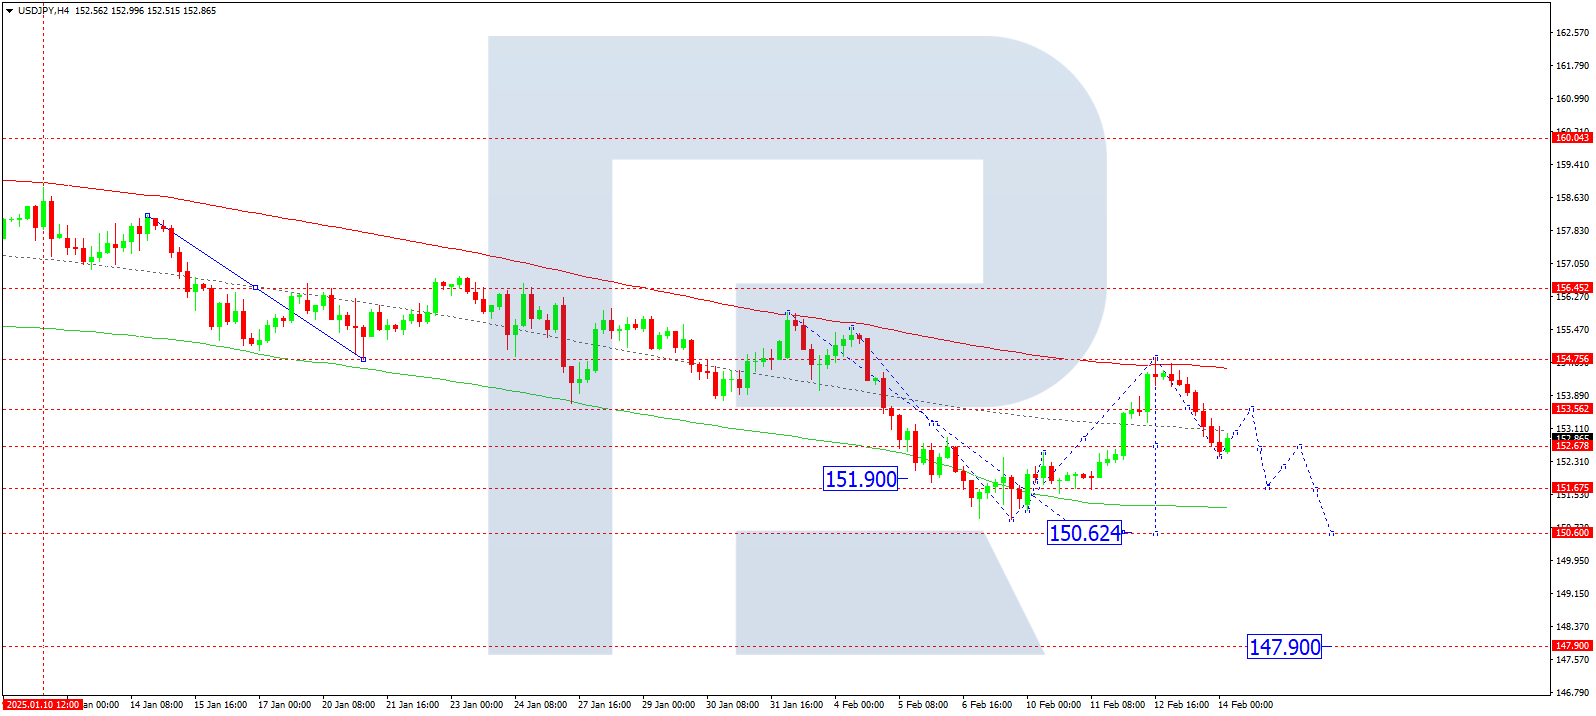
On the H4 chart, USDJPY completed a decline to 152.44. Today, 14 February 2025, a consolidation range is forming around this level. A downward breakout could lead to a decline towards 151.66, with a further trend continuation towards 150.62. If the price breaks upwards, the growth wave may extend towards 153.60.
Technically, this scenario for USDJPY is confirmed by the Elliott wave structure and the downward wave matrix with a pivot point at 152.66. Currently, the market has declined towards the central line of the price Envelope at 152.66 and is consolidating. A downward breakout towards the lower boundary at 150.62 remains likely.
Technical indicators for today's USDJPY forecast suggest the probability of a decline towards 151.66 and 150.62.
GBPUSD forecast
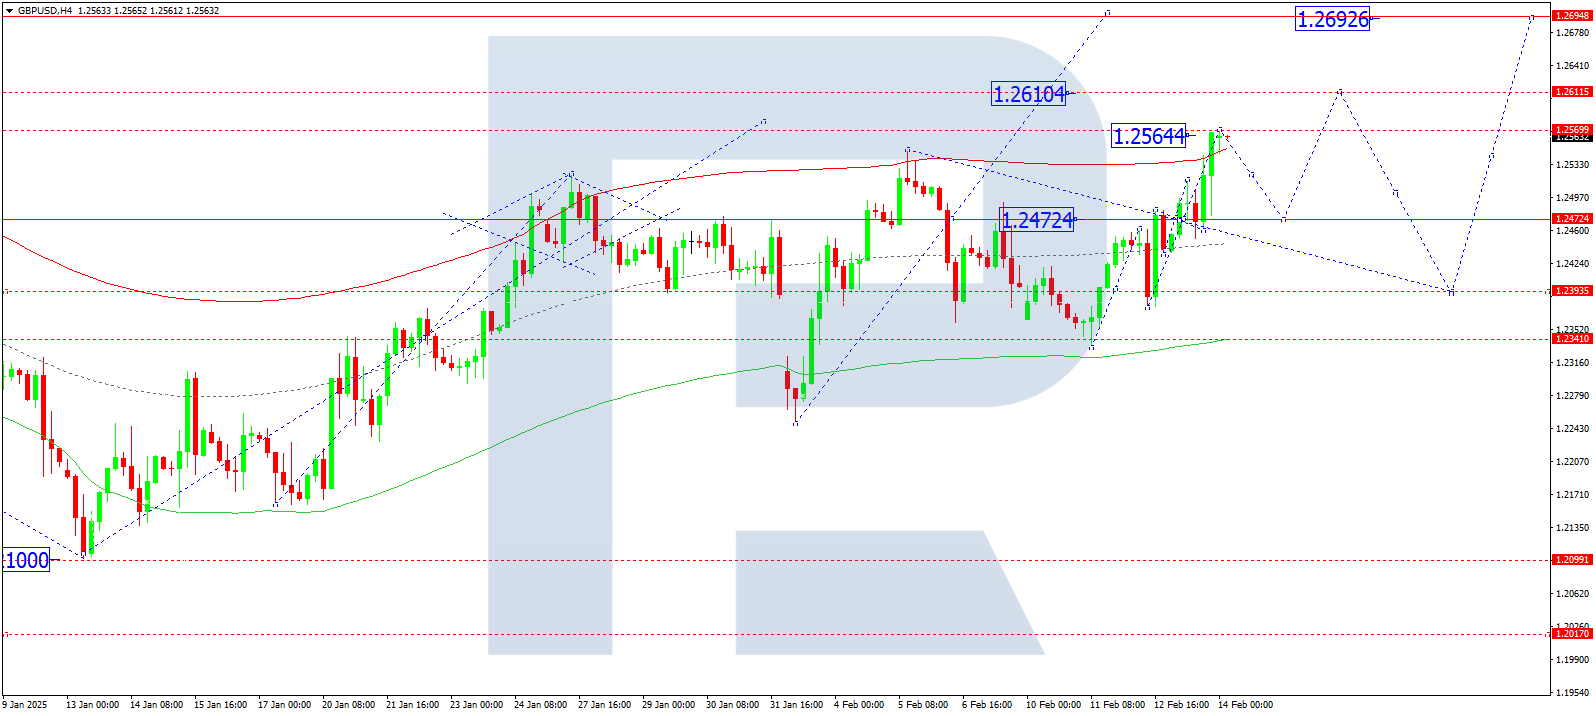
On the H4 chart, GBPUSD formed a consolidation range around 1.2472 and, after breaking upwards, completed a growth wave towards 1.2566. Today, 14 February 2025, a correction towards 1.2472 is expected. After completing this correction, a new growth wave towards 1.2611 may develop, with a potential trend continuation towards 1.2692.
Technically, this scenario for GBPUSD is confirmed by the Elliott wave structure and the growth wave matrix with a pivot point at 1.2472. Currently, the market has completed a growth wave towards the upper boundary of the price Envelope at 1.2566. A decline towards the central line at 1.2472 is expected.
Technical indicators for today's GBPUSD forecast suggest the probability of a correction towards 1.2472.
AUDUSD forecast
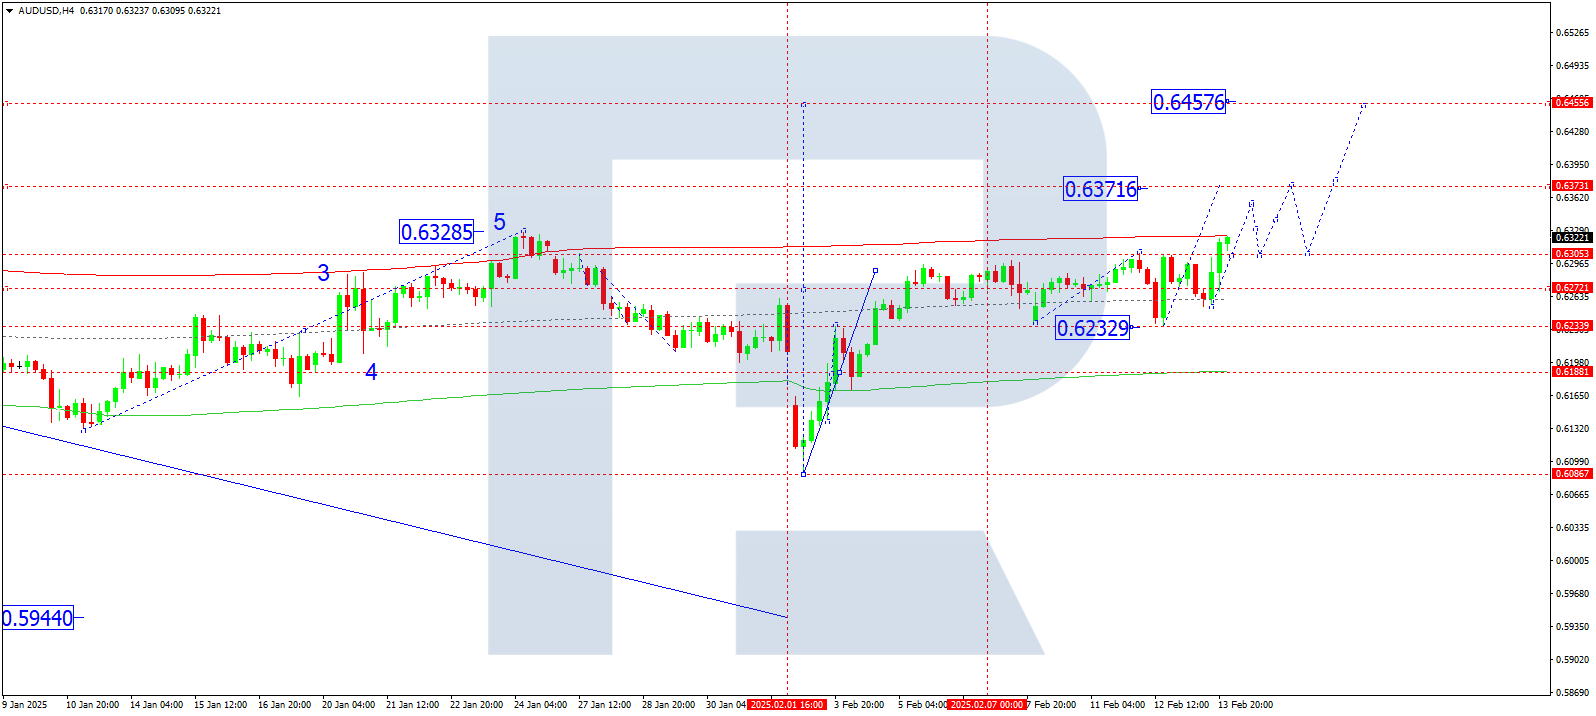
On the H4 chart, AUDUSD broke above 0.6300, effectively exiting the consolidation range upwards. Today, 14 February 2025, further growth towards 0.6371 is expected. After reaching this level, a correction towards 0.6300 is possible. Later, a new growth wave towards 0.6457 may develop.
Technically, this scenario is confirmed by the Elliott wave structure and the growth wave matrix for AUDUSD, with a pivot point at 0.6276. Currently, the market has broken out of the consolidation range upwards. Growth towards the upper boundary of the price Envelope at 0.6371 is expected. Later, a correction towards the central line at 0.6276 is possible.
Technical indicators for today's AUDUSD forecast suggest the probability of growth towards 0.6371.
USDCAD forecast
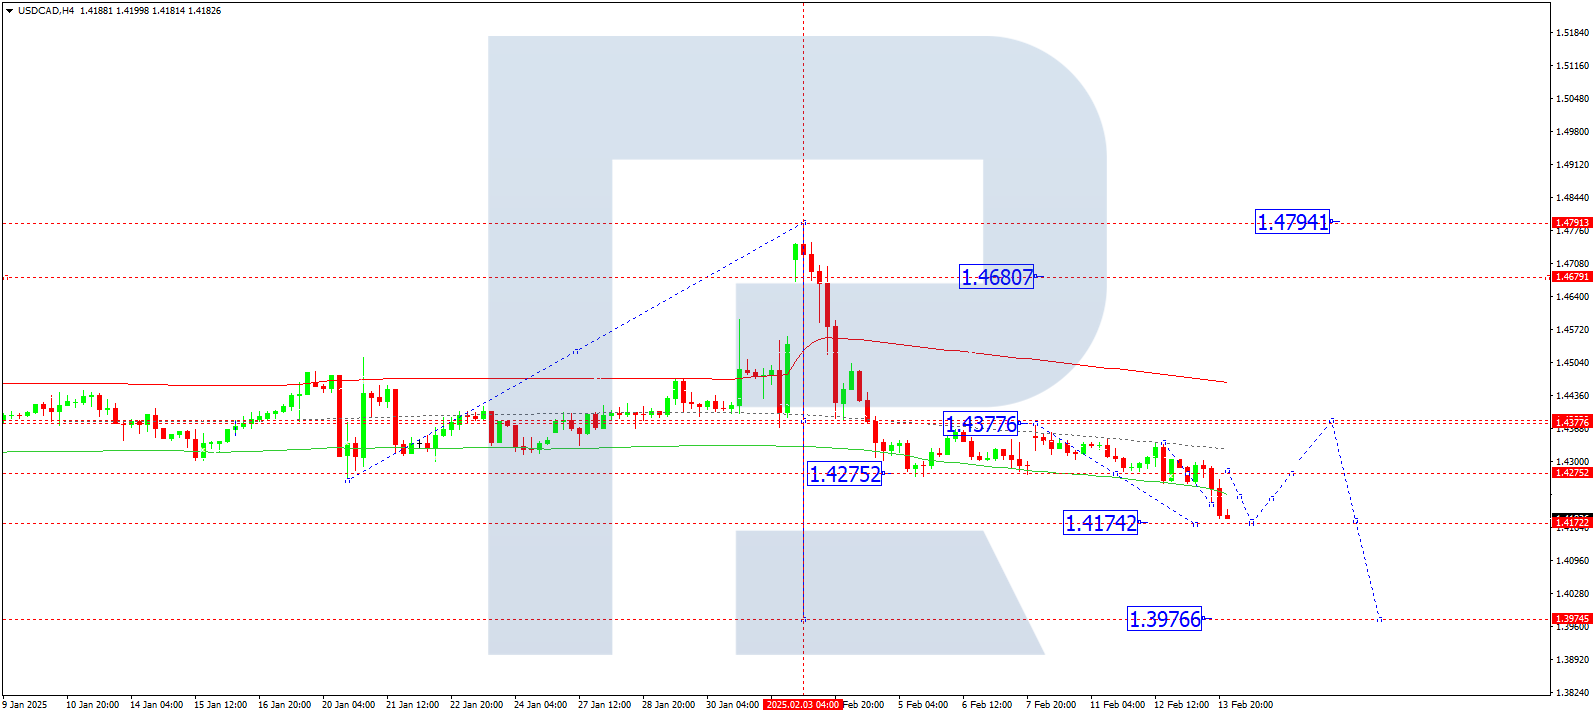
On the H4 chart, USDCAD continues consolidating around 1.4275. Today, 14 February 2025, a downward breakout towards 1.4174 is expected. Later, a growth wave towards 1.4377 may develop as the first target. After reaching this level, a correction back to 1.4275 is possible.
Technically, this scenario is confirmed by the Elliott wave structure and the downward wave matrix with a pivot point at 1.4275, considered a key level for USDCAD in this wave structure. Currently, the market is continuing its downward wave towards the lower boundary of the price Envelope at 1.4174. A subsequent upward wave towards the upper boundary at 1.4377 is expected.
Technical indicators for today's USDCAD forecast suggest the probability of a decline towards 1.4175.
XAUUSD forecast
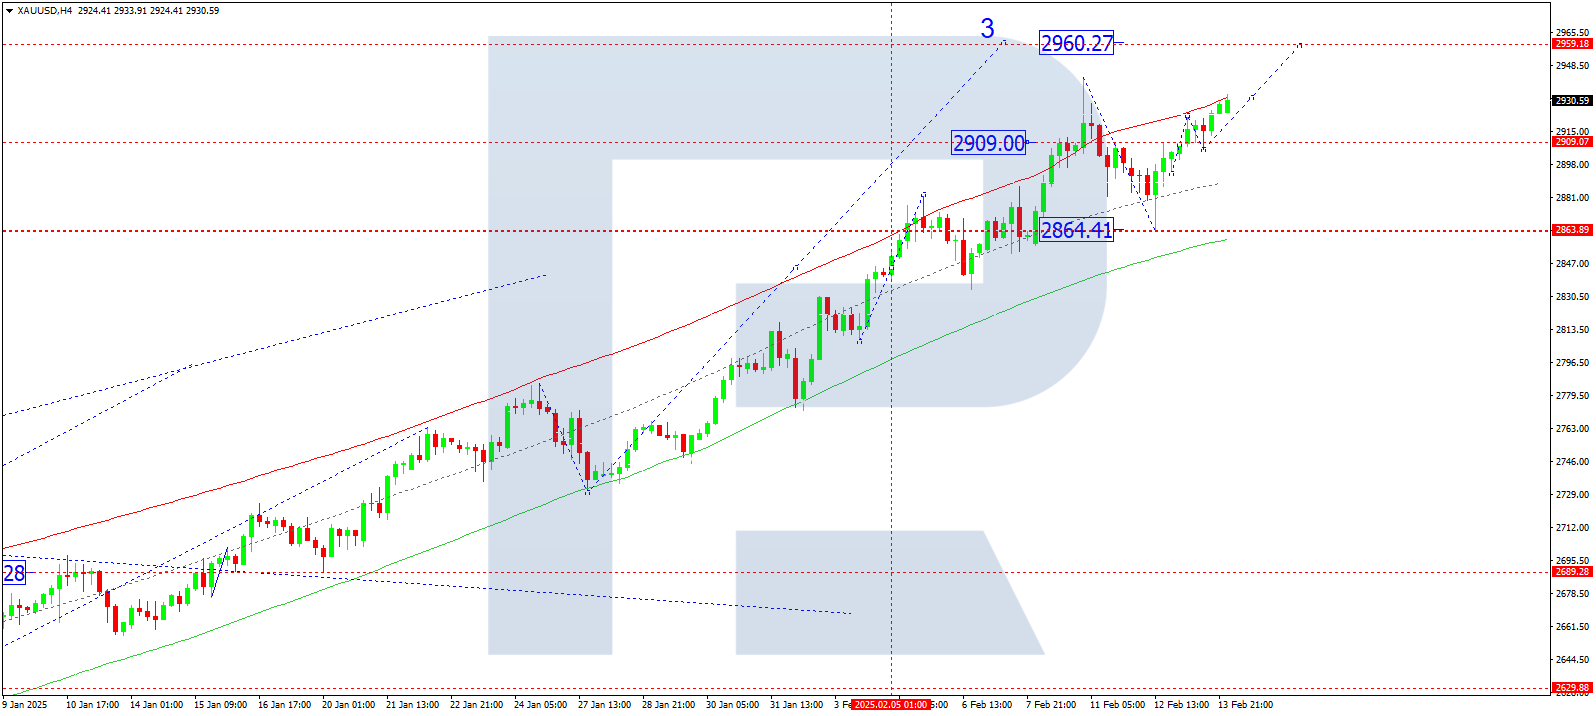
On the H4 chart, XAUUSD found support at 2909 USD and continues developing a growth wave. Today, 14 February 2025, the price has broken above 2920 USD, opening the potential for further growth towards 2960 USD. After reaching this level, a correction towards 2865 USD may follow.
Technically, this scenario is confirmed by the Elliott wave structure and the growth wave matrix with a pivot point at 2865 USD, considered a key level for XAUUSD in this wave. Currently, the market is forming a growth wave structure towards the upper boundary of the price Envelope at 2960 USD. After reaching this level, a correction towards the central line at 2865 USD is expected.
Technical indicators for today's XAUUSD forecast suggest the probability of growth towards 2960 USD.
Brent forecast
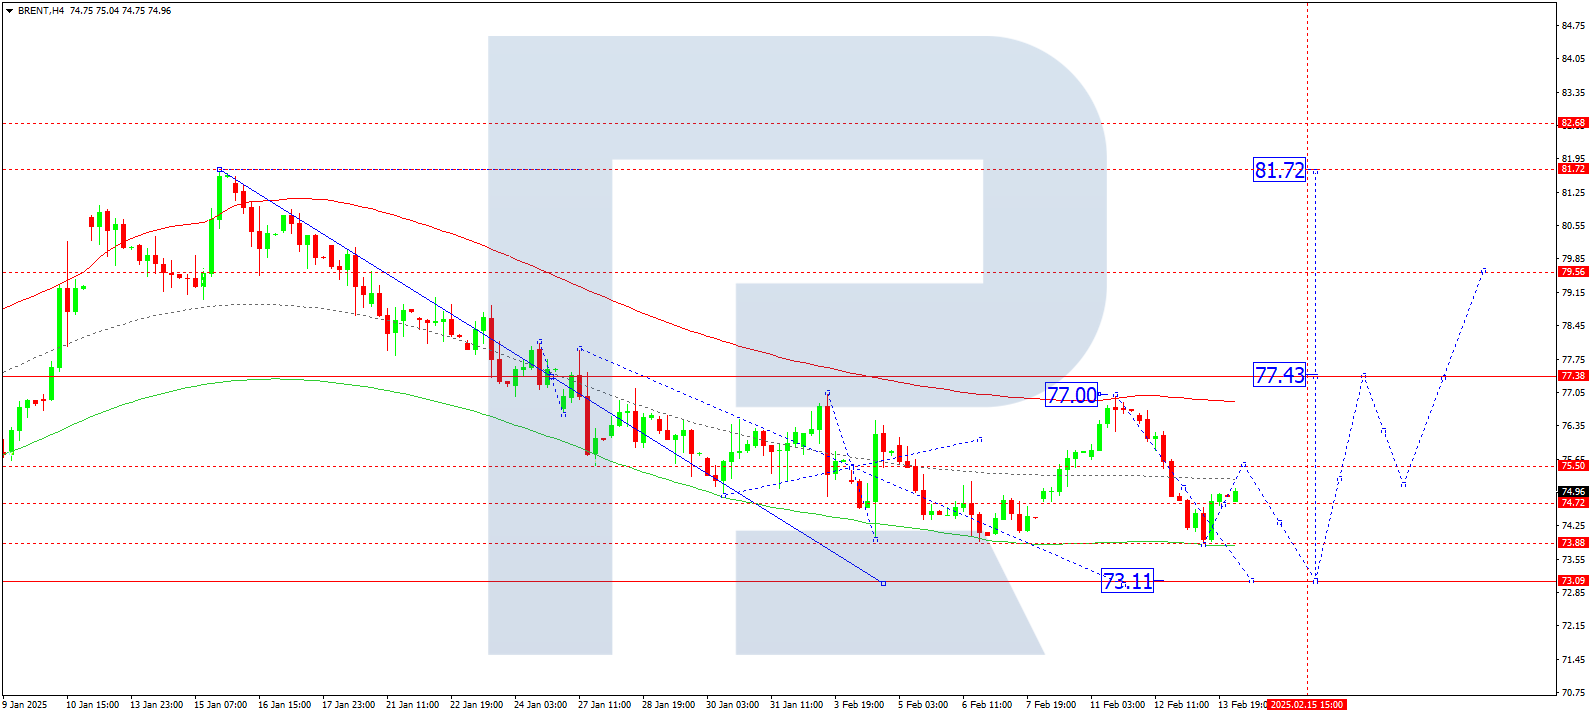
On the H4 chart, Brent completed a decline to 73.88. Today, 14 February 2025, a growth wave towards 75.50 is expected. After reaching this level, another decline towards 73.11 is possible before a new growth wave towards 77.43 develops as the first target.
Technically, this scenario is confirmed by the Elliott wave structure and the downward wave matrix with a pivot point at 77.43, considered a key level for Brent. Currently, the market is continuing its downward wave towards the lower boundary of the price Envelope at 73.11. A subsequent upward wave towards the upper boundary at 77.43 is expected.
Technical indicators for today's Brent forecast suggest the probability of a decline towards 73.11.
การคาดการณ์ที่นำเสนอในส่วนนี้จะสะท้อนให้เห็นความคิดเห็นส่วนตัวของผู้แต่งเท่านั้น และจะไม่สามารถถูกพิจารณาว่าเป็นแนวทางสำหรับการซื้อขาย RoboForex ไม่รับผิดชอบสำหรับผลลัพธ์การซื้อขายที่อ้างอิงตามคำแนะนำการซื้อขายที่อธิบายเอาไว้ในบทวิจารณ์การวิเคราะห์เหล่านี้