EURUSD, USDJPY, GBPUSD, AUDUSD, USDCAD, XAUUSD, and Brent technical analysis and forecast for 22 January 2025
Here is a detailed daily technical analysis and forecast for EURUSD, USDJPY, GBPUSD, AUDUSD, USDCAD, XAUUSD, and Brent for 22 January 2025.
EURUSD forecast
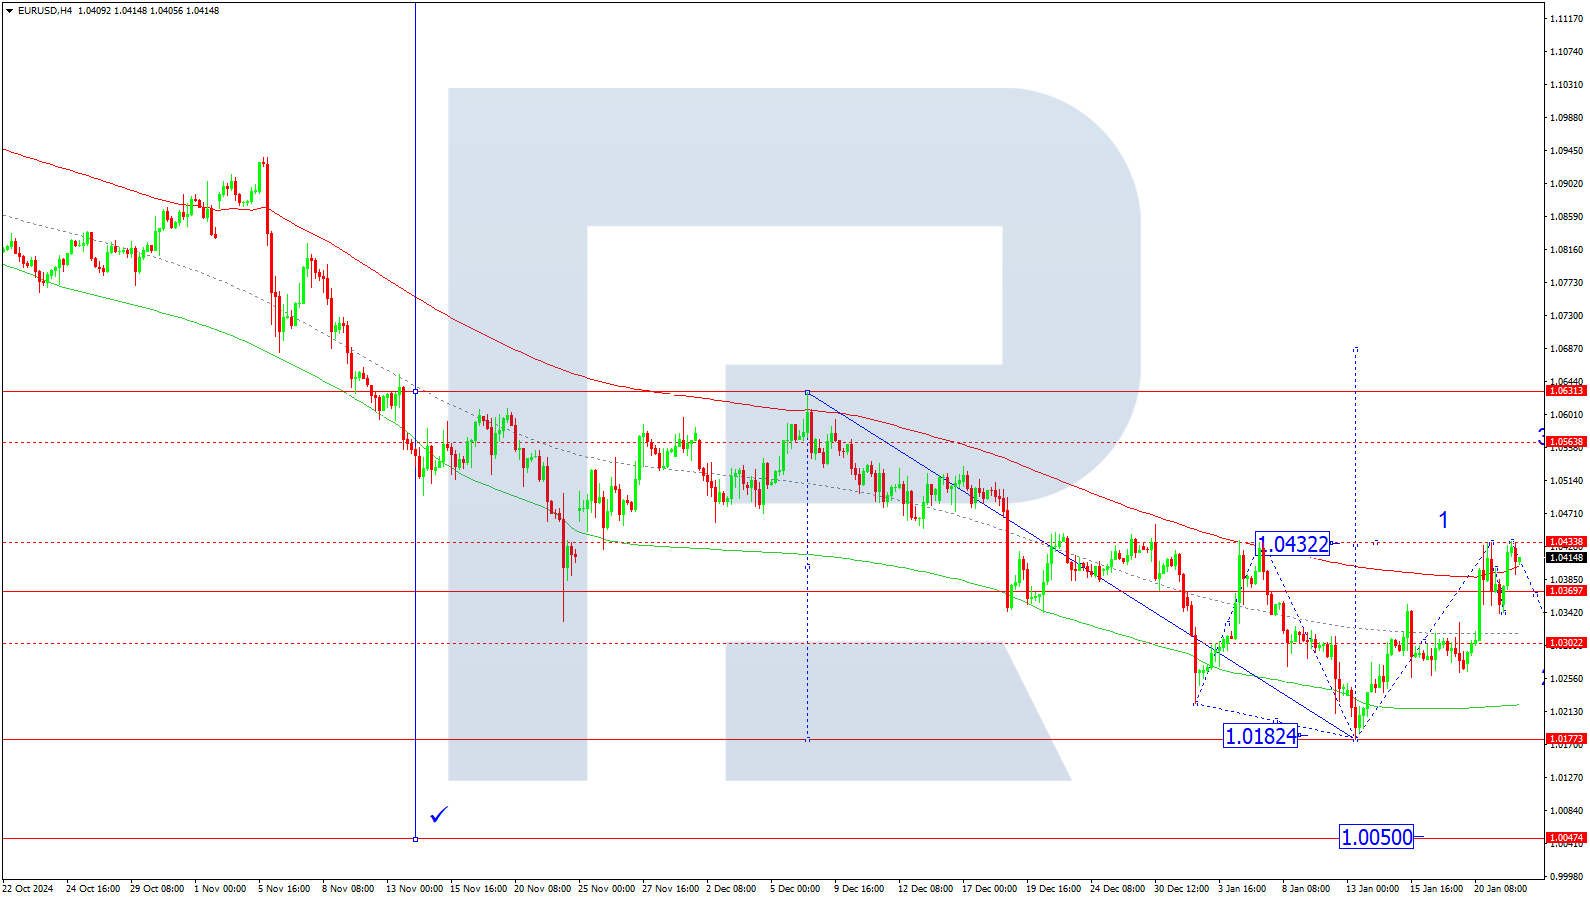
On the H4 chart, EURUSD has formed a consolidation range around 1.0370. On 22 January 2025, an upward breakout could lead to a growth wave towards 1.0440. After reaching this target, a downward wave to 1.0300 is expected.
Technically, this scenario aligns with the Elliott Wave structure and the first-wave growth matrix centred at 1.0300, which is crucial for the EURUSD forecast. The market is forming a growth structure towards the upper boundary of the price Envelope at 1.0440. After reaching this level, a correction to the central line at 1.0300 may follow.
Technical indicators for today’s EURUSD forecast suggest potential growth to 1.0440.
USDJPY forecast
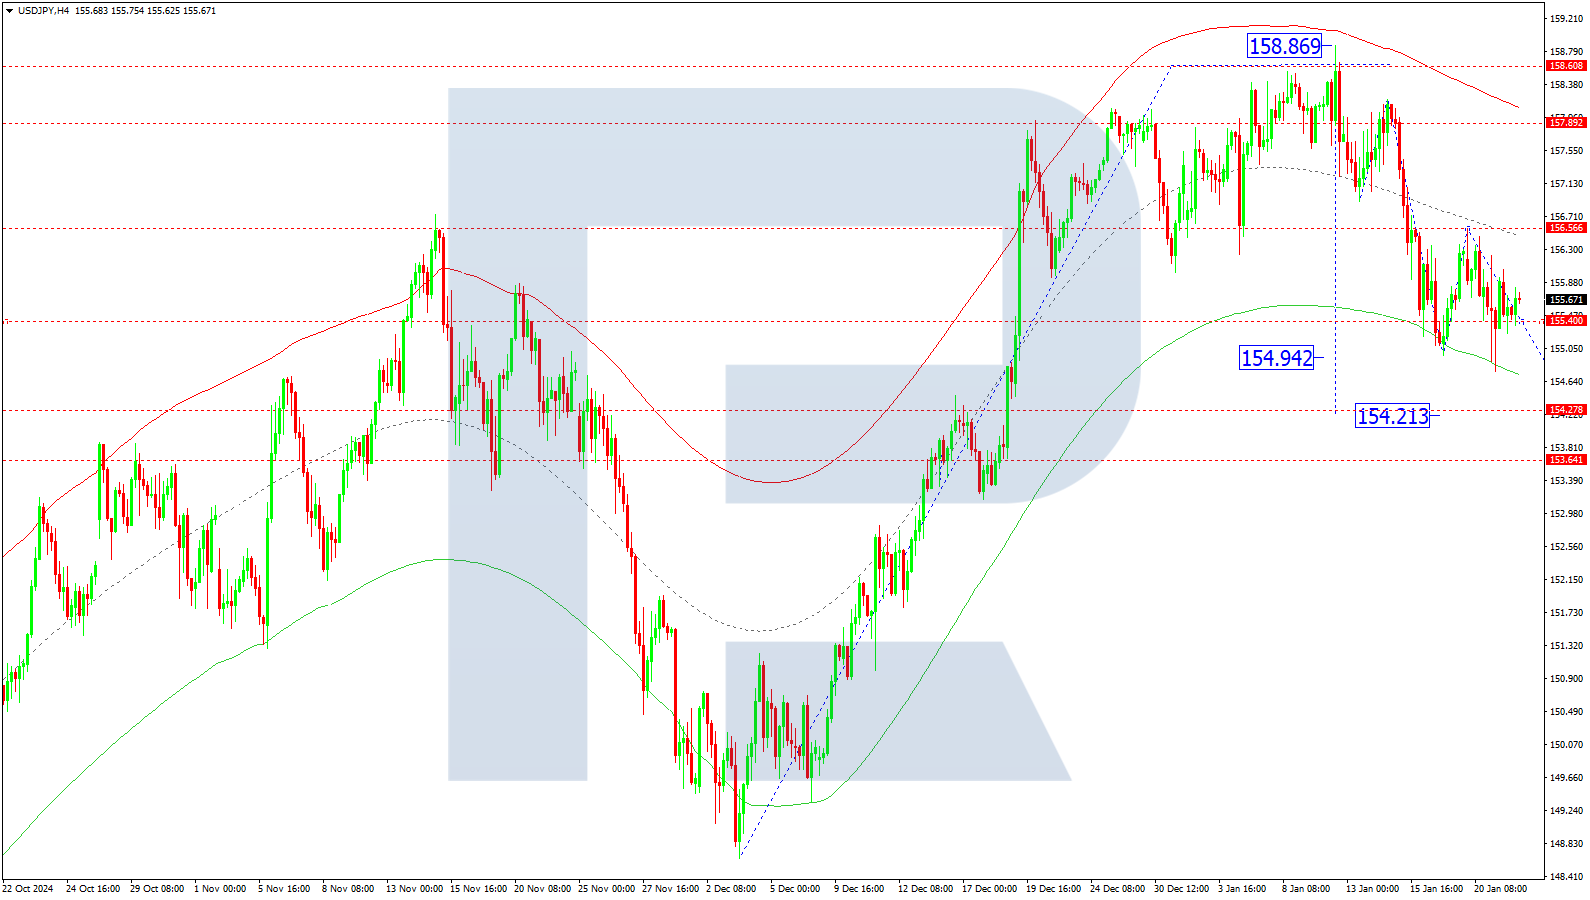
On the H4 chart, USDJPY is consolidating around 155.66. On 22 January 2025, a growth wave to 156.56 is possible, followed by a downward wave to 154.20 as the first target. After reaching this level, another growth wave towards 156.56 is expected.
Technically, this scenario aligns with the Elliott Wave structure and the correction matrix centred at 156.56. The market has rebounded from the lower boundary of the price Envelope at 154.79 and is developing a growth structure towards its central line. After reaching 156.56, a downward wave to the lower boundary at 154.20 may develop.
Technical indicators for today’s USDJPY forecast suggest potential growth to 156.56.
GBPUSD forecast
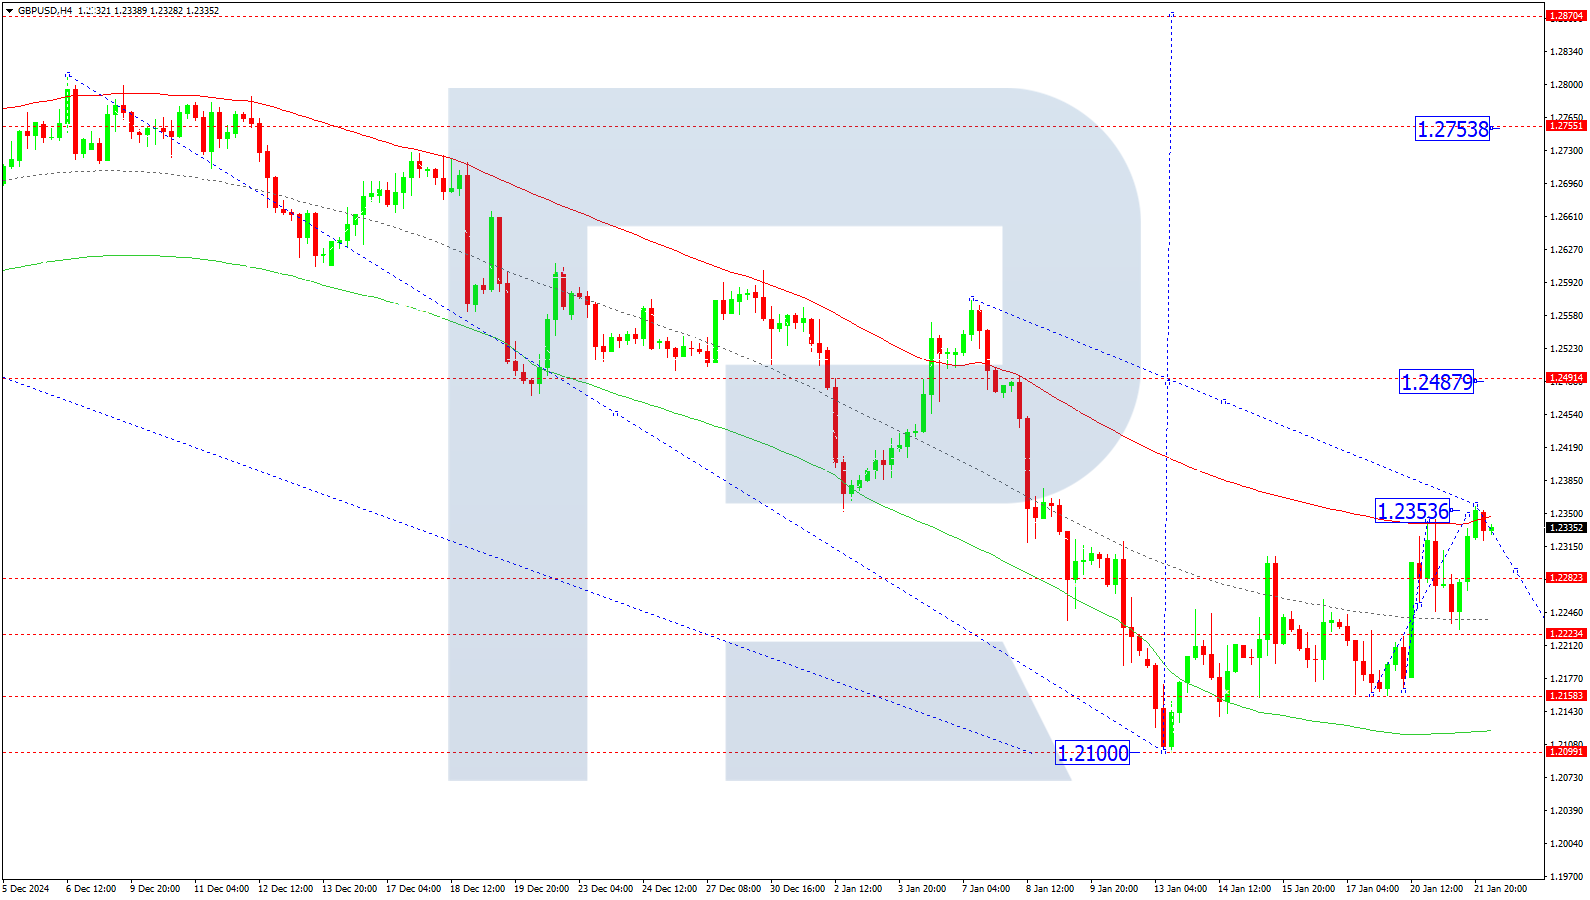
On the H4 chart, GBPUSD completed a growth wave to 1.2359 and is now forming a consolidation range below this level. On 22 January 2025, a downward breakout could lead to a correction to 1.2222, while an upward breakout may allow further growth to 1.2487 as the local target.
Technically, this scenario aligns with the Elliott Wave structure and the first-wave growth matrix centred at 1.2222. The market has reached the upper boundary of the price Envelope at 1.2359, and a decline to the central line at 1.2222 is anticipated.
Technical indicators for today’s GBPUSD forecast suggest a decline to 1.2222.
AUDUSD forecast
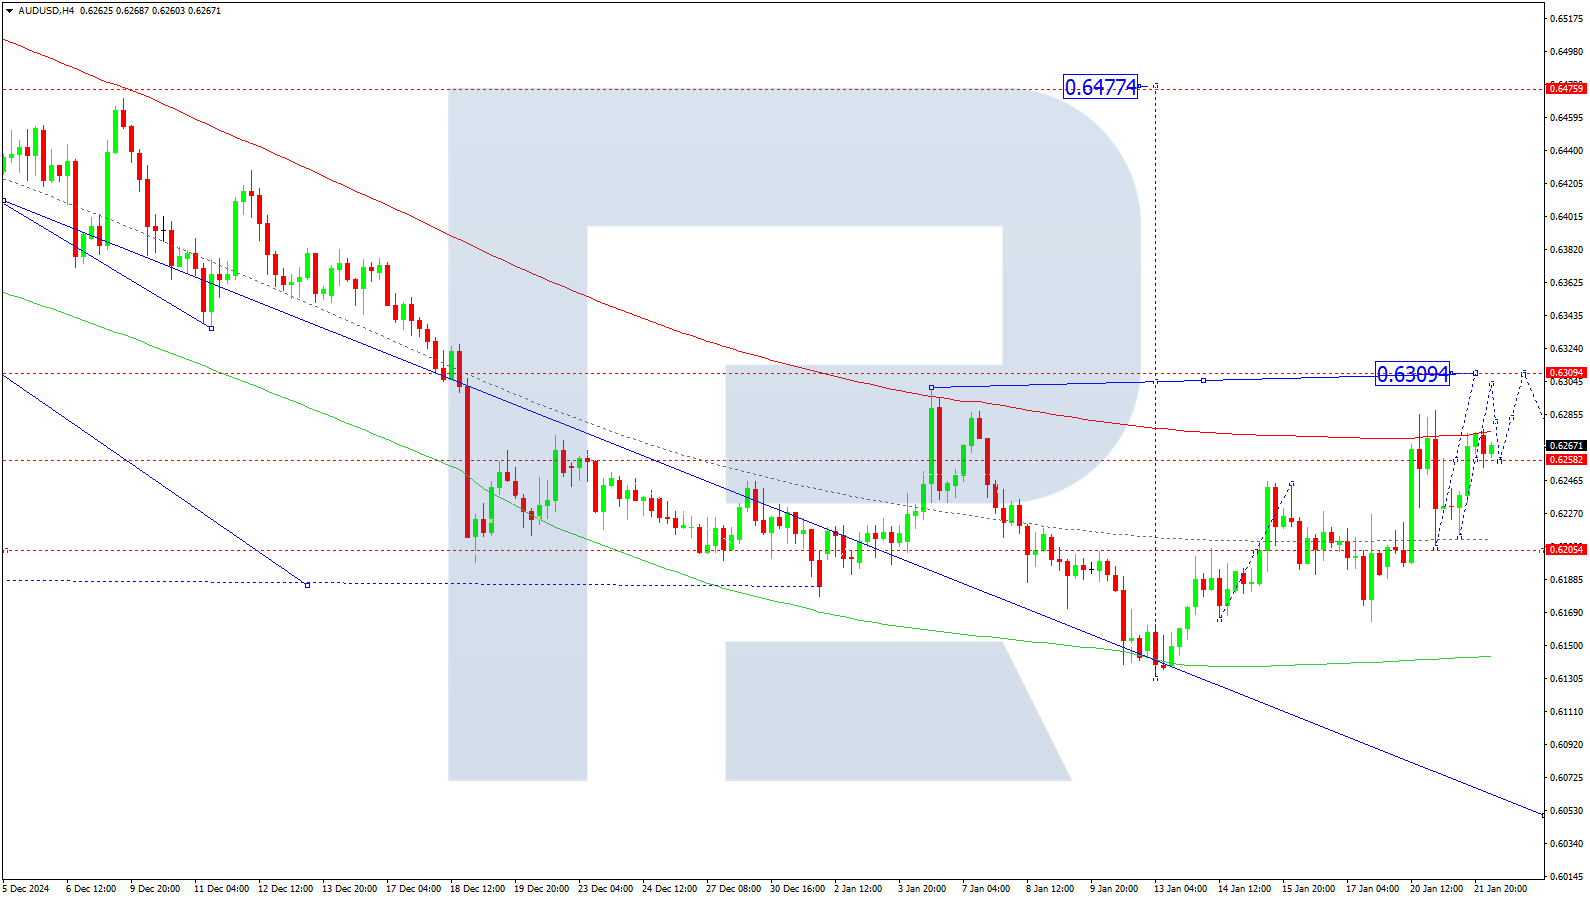
On the H4 chart, AUDUSD is consolidating around 0.6258. On 22 January 2025, an upward breakout could lead to growth towards 0.6309, while a downward breakout may extend the decline to 0.6200.
Technically, this scenario aligns with the Elliott Wave structure and the growth wave matrix centred at 0.6200. The market has completed the first growth wave to the upper boundary of the price Envelope at 0.6287. A potential decline to the lower boundary at 0.6200 is likely.
Technical indicators for today’s AUDUSD forecast suggest a decline to 0.6200.
USDCAD forecast
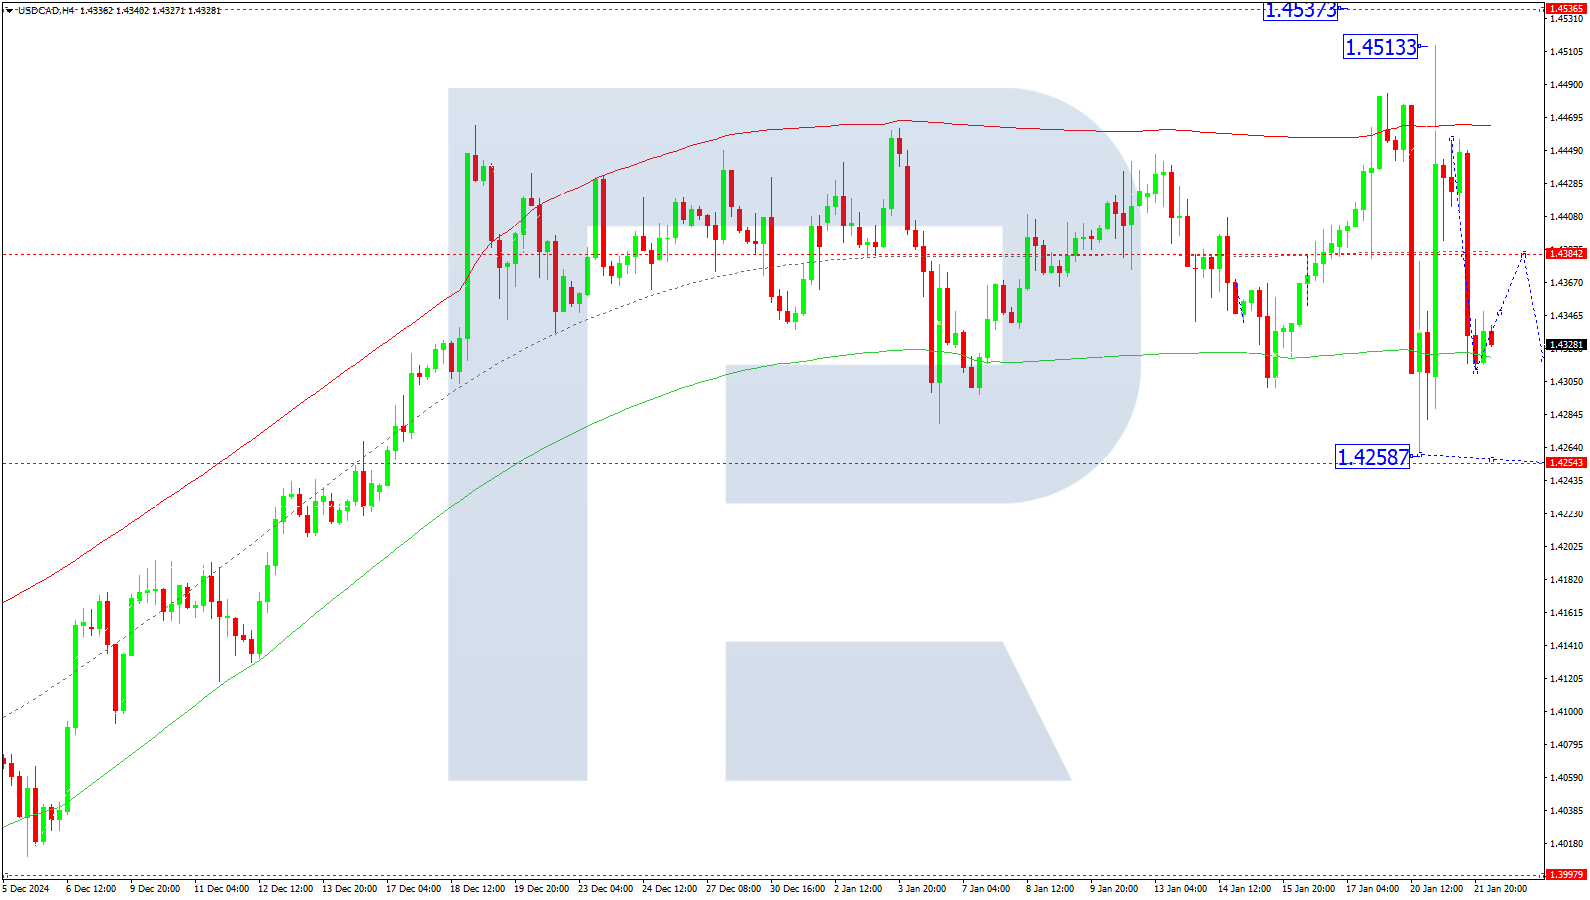
On the H4 chart, USDCAD completed a downward impulse to 1.4393, followed by a correction to 1.4456. On 22 January 2025, the market broke below 1.4384 and reached the local target of 1.4311. A consolidation range is forming above this level. Growth towards 1.4384 is expected, followed by a potential decline to 1.4255 as the first target.
Technically, this scenario aligns with the Elliott Wave structure and the downward wave matrix centred at 1.4384, which is crucial for the USDCAD outlook. The market has reached the lower boundary of the price Envelope at 1.4311 and is likely to develop a growth wave to the central line at 1.4384.
Technical indicators for today’s USDCAD forecast suggest a growth wave towards 1.4384.
XAUUSD forecast
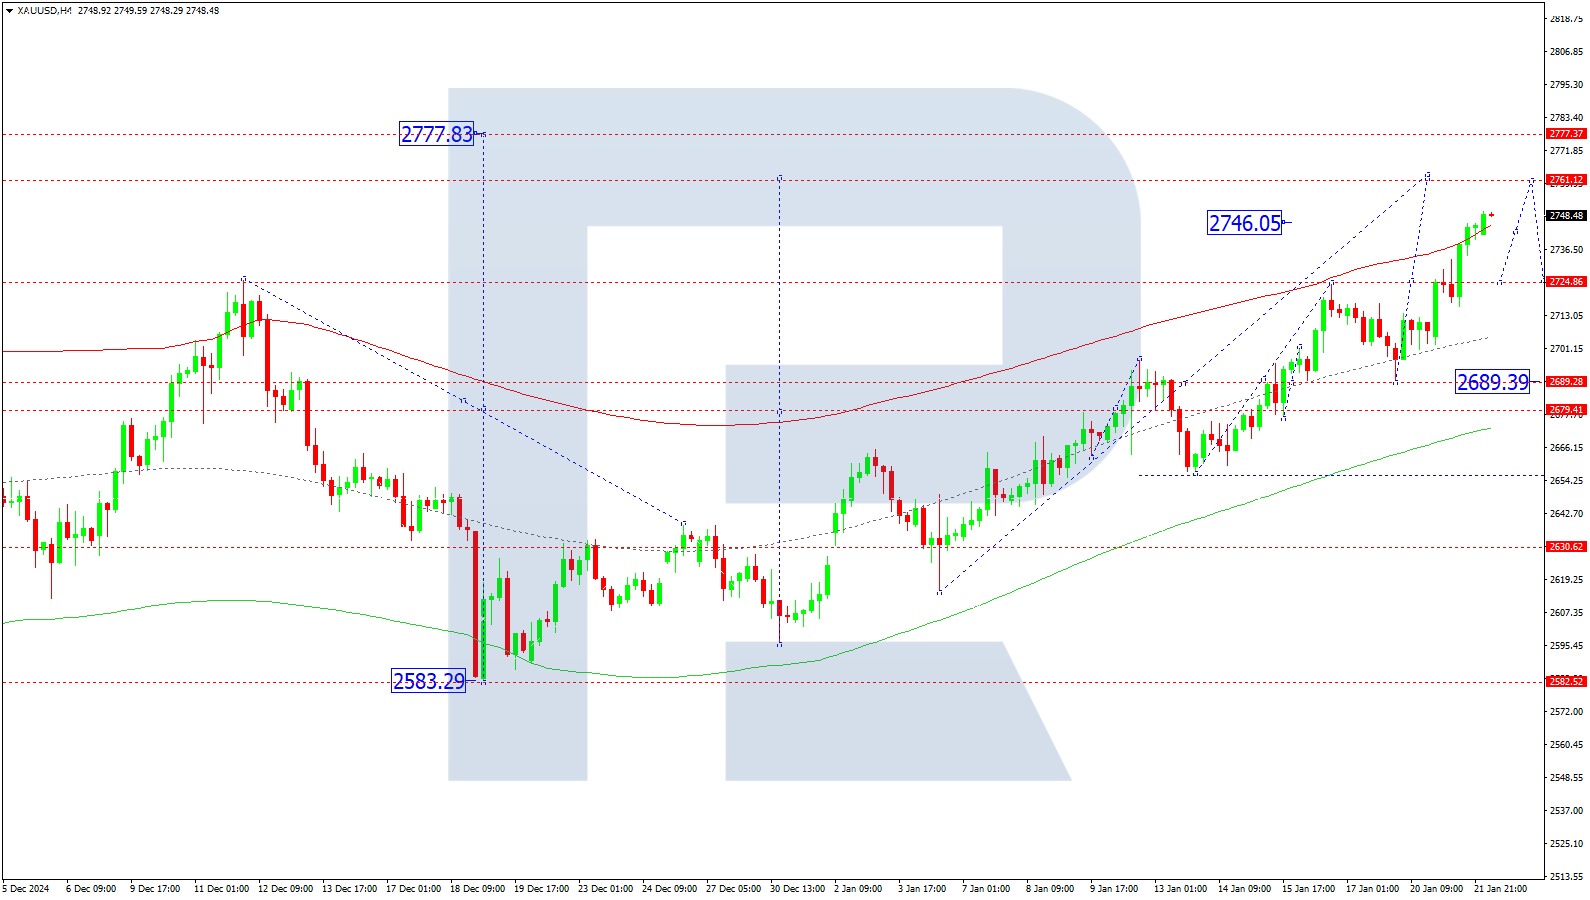
On the H4 chart, XAUUSD broke above 2,724 and continues to grow to 2,761. This target level is expected to be reached on 22 January 2025, and a correction to 2,724 may follow. Conversely, further downward movement to 2,689 is possible if the market breaks below this level.
Technically, this scenario aligns with the Elliott Wave structure and the growth wave matrix centred at 2,689, which is crucial for XAUUSD prediction. The market is developing a growth wave towards the upper boundary of the price Envelope at 2,761, with a potential decline to the lower boundary at 2,689 likely.
Technical indicators for today’s XAUUSD forecast suggest potential growth towards 2,761.
Brent forecast
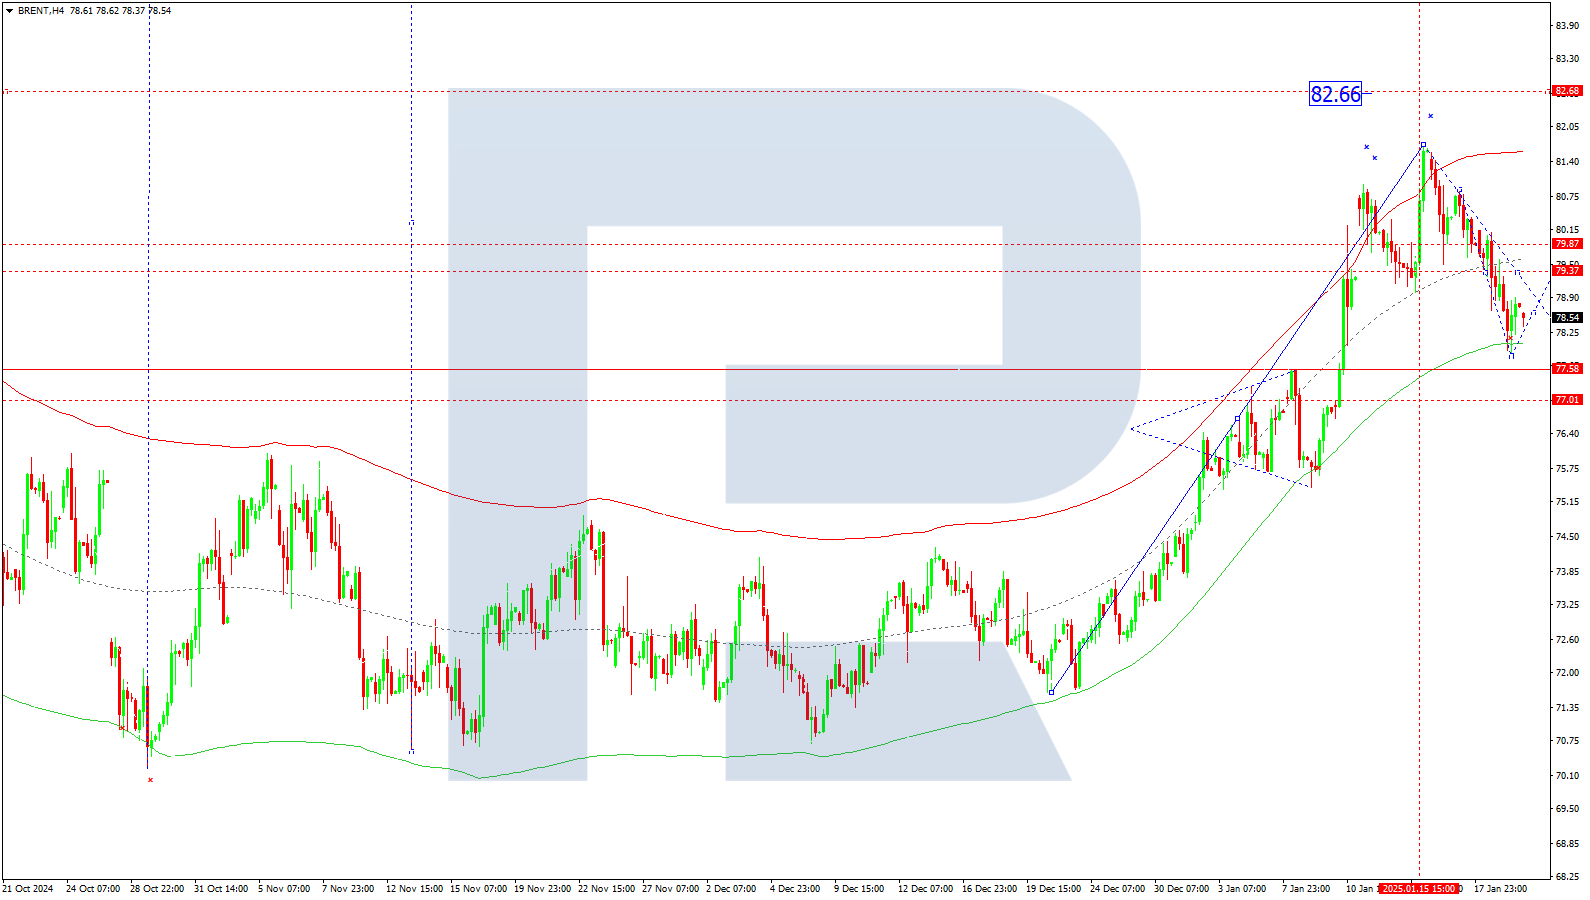
On the H4 chart, Brent crude completed a downward wave to 77.87. On 22 January 2025, growth to 79.37 (retesting from below) is expected, followed by a potential decline to 77.00.
Technically, this scenario aligns with the Elliott Wave structure, and the downward wave matrix centred at 79.37, which is crucial for Brent. The market has completed a downward wave to the lower boundary of the price Envelope at 77.87, with potential growth towards its central line at 79.37.
Technical indicators for today’s Brent forecast suggest a growth wave to 79.37.
การคาดการณ์ที่นำเสนอในส่วนนี้จะสะท้อนให้เห็นความคิดเห็นส่วนตัวของผู้แต่งเท่านั้น และจะไม่สามารถถูกพิจารณาว่าเป็นแนวทางสำหรับการซื้อขาย RoboForex ไม่รับผิดชอบสำหรับผลลัพธ์การซื้อขายที่อ้างอิงตามคำแนะนำการซื้อขายที่อธิบายเอาไว้ในบทวิจารณ์การวิเคราะห์เหล่านี้

