Gold (XAUUSD) is on the rise amid expectations of US employment data
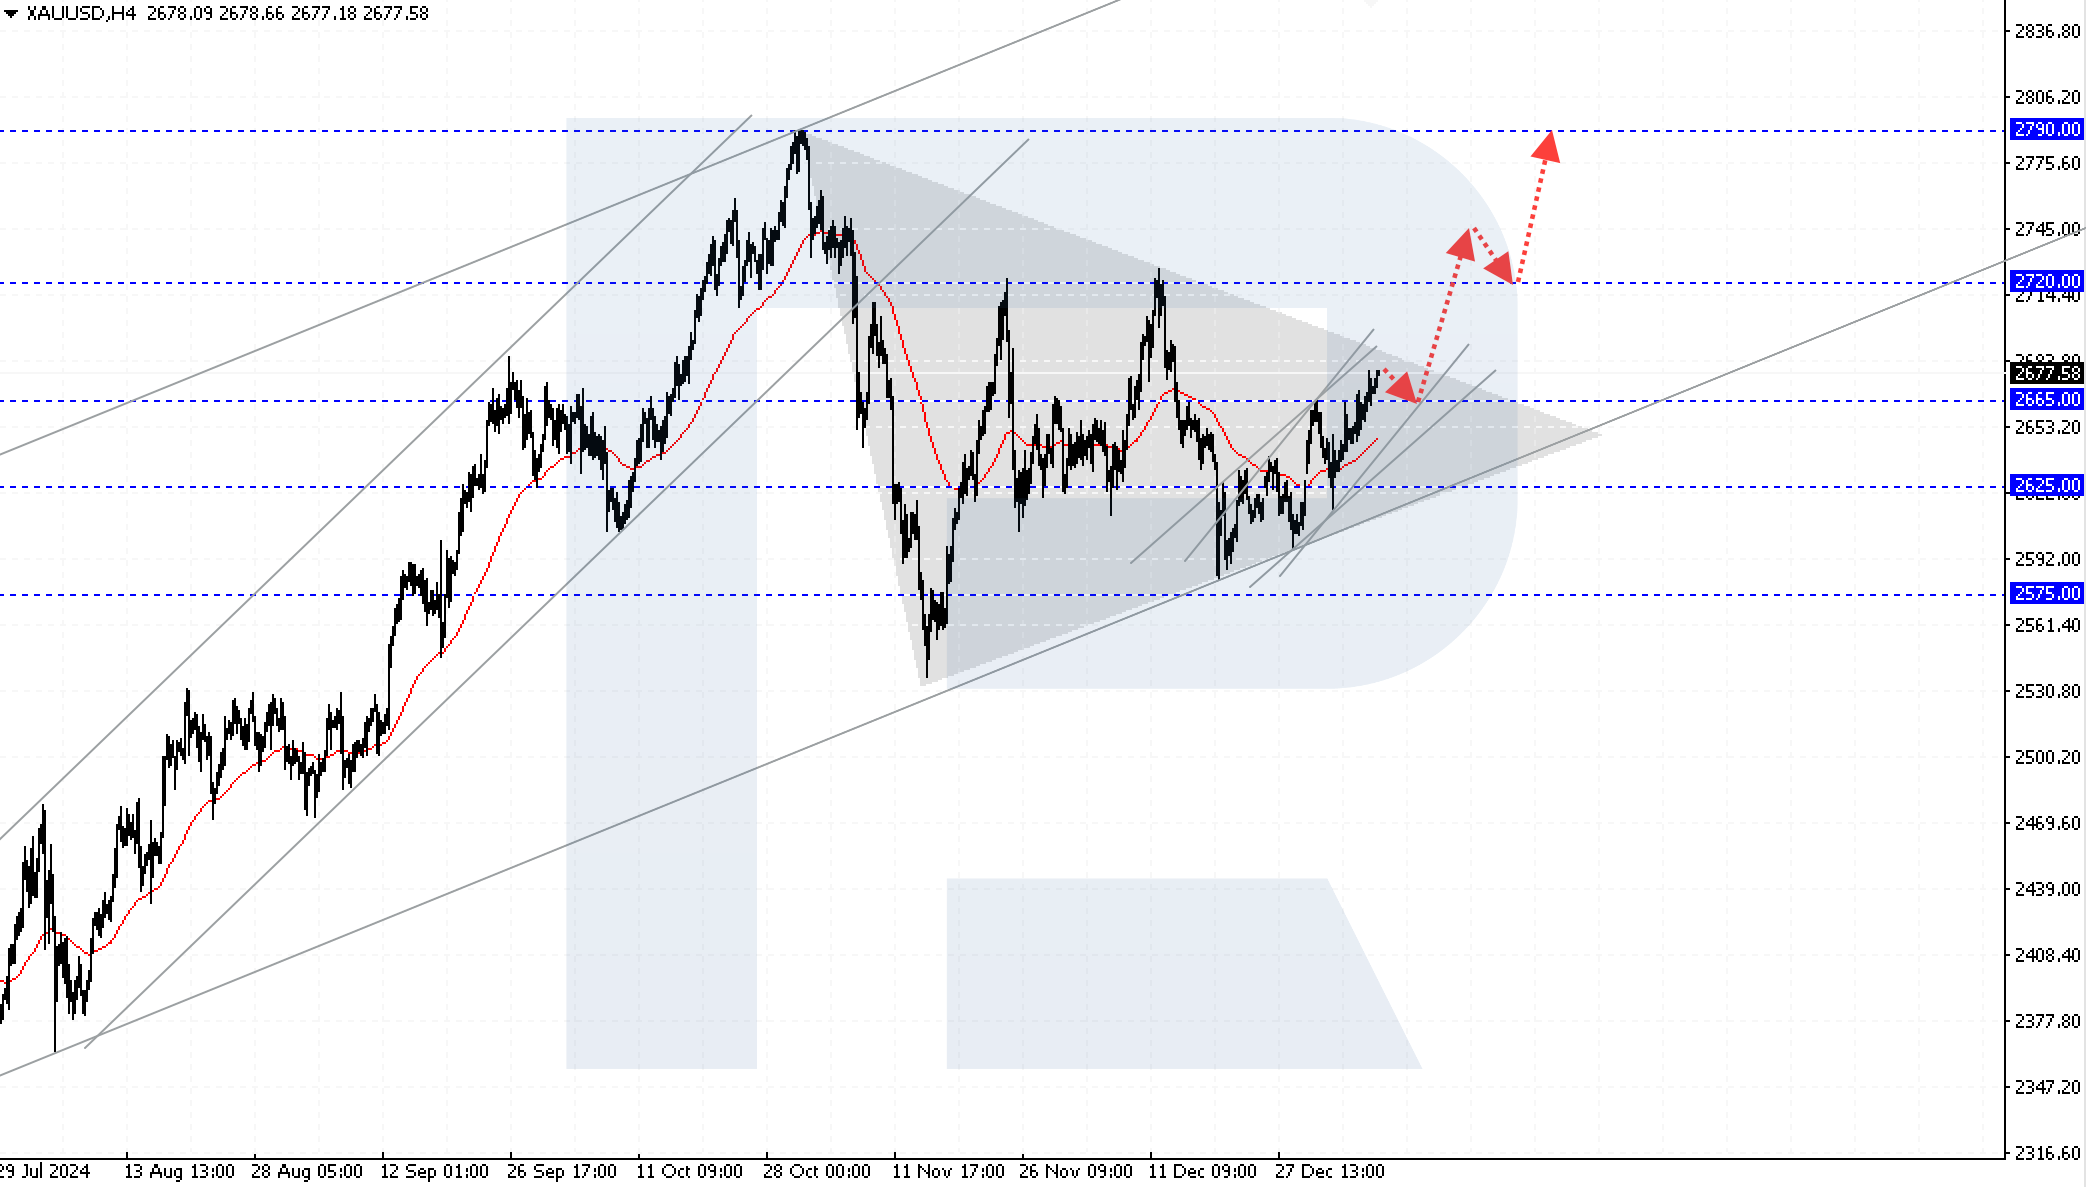
XAUUSD quotes are rising for the fourth consecutive trading session, with buyers poised to test the 2,720 USD level. Find out more in our analysis for 10 January 2025.
XAUUSD forecast: key trading points
- Market focus: all eyes are on US employment data
- Current trend: the quotes are trading within a triangle pattern
- XAUUSD forecast for 10 January 2025: 2,720 and 2,790
Fundamental analysis
Gold is strengthening for the second consecutive week, with buyers holding a crucial support level at 2,670 USD. Today, traders will focus on the upcoming US employment data release, which could influence the Federal Reserve’s future monetary policy direction this year. The December report is expected to show moderate growth, with the reading projected at 176 thousand compared to the previous 227 thousand.
Against this backdrop, robust employment data will add to the arguments favouring fewer Fed rate cuts. This aligns with the latest FOMC minutes, which mention the probability of slower monetary policy easing, with increasing inflation risks cited as the main reason.
XAUUSD technical analysis
On the H4 chart, XAUUSD prices approached the upper boundary of a triangle pattern. In case of a breakout above it, the nearest growth target could be the 2,720 USD resistance level, with the long-term target at 2,925 USD. The release of US labour market statistics could catalyse the rise.
According to the XAUUSD forecast, buyers might face a negative scenario if prices break below the 2,665 USD support level. This will increase the likelihood of a bearish correction towards the triangle’s lower boundary at 2,625 USD.
Summary
Gold maintains its upward momentum amid expectations of US employment data. A strong report may increase the chances of a slower Federal Reserve interest rate reduction. The XAUUSD price forecast points to the proximity of the upper boundary of the triangle pattern. Breaking above this will pave the way to 2,720 USD and, subsequently, to the 2,790 USD level. However, if prices consolidate below the 2,670 USD support level, the risk of a bearish correction towards the pattern’s lower boundary at 2,625 USD will increase.
การคาดการณ์ที่นำเสนอในส่วนนี้จะสะท้อนให้เห็นความคิดเห็นส่วนตัวของผู้แต่งเท่านั้น และจะไม่สามารถถูกพิจารณาว่าเป็นแนวทางสำหรับการซื้อขาย RoboForex ไม่รับผิดชอบสำหรับผลลัพธ์การซื้อขายที่อ้างอิงตามคำแนะนำการซื้อขายที่อธิบายเอาไว้ในบทวิจารณ์การวิเคราะห์เหล่านี้


